
R21xx-HP FlexFabric 11900 Network Management and Monitoring Command Reference


176
Parameters
dumbtty: Specifies dumbtty mode. In this mode, the command displays all thread statistics in descending
order of CPU usage without refreshing statistics. If you do not specify the keyword, the command displays
statistics for top 10 processes in descending order of CPU usage in an interactive mode, and refreshes
statistics every 5 seconds by default.
iteration number: Specifies the number of display times, in the range of 1 to 4294967295. If you specify
the dumbtty keyword, the number argument is 1 by default. If neither the dumbtty keyword nor the
number argument is specified, there is no limit to the display times.
slot slot-number: Specifies a card by its slot number. Without this option, the command displays thread
statistics for the active MPU. (In standalone mode.)
chassis chassis-number slot slot-number: Specifies a card on an IRF member device. Without this option,
the command displays thread statistics for the global active MPU. (In IRF mode.)
Usage guidelines
If you do not specify the dumbtty keyword, the command displays thread statistics in an interactive mode.
In this mode, the system automatically determines the number of displayed thread processes according
to the screen size and does not display exceeding processes. You can also input interactive commands
as shown in Table 48 to pe
rform relevant operations.
Table 48 Interactive commands
Commands Descri
p
tion
? or h Displays help information that includes available interactive commands.
d Sets the interval for refreshing statistics. The default interval is 5 seconds.
k
Kills a process. Because the command can impact system operation, be cautious when
you use it.
l Refreshes the screen.
n
Changes the maximum number of threads displayed within a screen, in the range of 0 to
2147483647. The default value is 10. A value of 0 means no limit. Only threads not
exceeding the screen size can be displayed.
q Quits interactive mode.
< Moves sort field to the next left column.
> Moves sort field to the next right column.
Examples
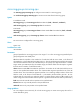
# Display thread statistics in dumbtty mode.
<Sysname> monitor thread dumbtty
84 processes; 107 threads
Thread states: 1 running, 106 sleeping, 0 stopped, 0 zombie
CPU states: 83.19% idle, 1.68% user, 10.08% kernel, 5.04% interrupt
Memory: 755M total, 417M available, page size 4K
JID TID LAST_CPU PRI State HH:MM:SS MAX CPU Name
1175 1175 0 120 R 00:00:00 1 10.75% top
1 1 0 120 S 00:00:06 1 2.68% scmd
881 881 0 120 S 00:00:09 1 2.01% diagd
776 776 0 120 S 00:00:01 0 0.67% [DEVD]