HP Comware 5 Comware 5 Debug Manual Volume 3 Part number: 5998-5838
Legal and notice information © Copyright 2014 Hewlett-Packard Development Company, L.P. No part of this documentation may be reproduced or transmitted in any form or by any means without prior written consent of Hewlett-Packard Development Company, L.P. The information contained herein is subject to change without notice.
Contents MAC authentication debugging commands ················································································································· 1 debugging mac-authentication································································································································ 1 MAC-in-MAC debugging commands ···························································································································· 6 debugging minm ··················
Multicast VPN debugging commands ·························································································································98 debugging md ······················································································································································· 98 debugging mtunnel ············································································································································· 101 MVRP debugging commands
Port security debugging commands ·························································································································· 224 debugging port-security ······································································································································ 224 Portal debugging commands ····································································································································· 230 debugging portal·········
RPR debugging commands ········································································································································ 308 debugging rpr error ············································································································································ 308 debugging rpr event ··········································································································································· 309 debugging rpr fsm ·
debugging ssh client ··········································································································································· 419 SSL debugging commands ········································································································································ 424 debugging ssl ······················································································································································ 424 SSL VPN debug
debugging firewall http java-blocking ·············································································································· 534 debugging firewall http activex-blocking ·········································································································· 535 vi
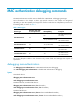
MAC authentication debugging commands The MAC authentication module name is identified as "MACAUTH" in debugging messages. Some information in this chapter is device type specific. Devices in this chapter are categorized depending on their IRF capability and support for interface cards that use independent processors for forwarding traffic, as shown in Table 1.
Default MAC authentication debugging is disabled. Views User view Default command level 1: Monitor level Parameters event: Specifies MAC authentication event debugging. slot slot-number: Specifies a card by its slot number. (Distributed device—In standalone mode.) slot slot-mumber: Specifies an IRF member device by its member ID. (Centralized IRF devices.) chassis chassis-number slot slot-number: Specifies a card on an IRF member device.
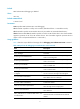
Field Description MacAuth is configuring or already disabled ,can't add src drop mac . MAC authentication is under configuration or has been disabled. The device cannot add the MAC address to the MAC address table that contains blocked MAC addresses. Broadcast send a MAC address syn add msg The device broadcast the synchronization message for a new MAC. Broadcast send a new slot inserted notify msg ,new slot is :SlotID The device broadcast the message to notify the insertion of a new card.
Field Description When a new card was inserted, port security was not enabled and MAC authentication was enabled on the card. After the insertion, MAC authentication is enabled on the new card. (Distributed devices.) SlotInsert, Portsec not enabled, macauth enabled ,enable macauth on new slot! When a new member device was inserted, port security was not enabled and MAC authentication was enabled on the device. After the insertion, MAC authentication is enabled on the new member device.
Field Description An MGV entry has had no packets matching it and therefore needs to be deleted. No packets match the MGV entry. The MGV entry will be deleted. Failed to process MGV for the same MGV entry. The MAC authentication module failed to process MGV because the same MGV entry already exists. Examples # Enable MAC authentication event debugging.
MAC-in-MAC debugging commands The MAC-in-MAC module name is identified as "MINM" in debugging messages. The output description tables in this document only contain fields and messages that require an explanation. debugging minm Use debugging minm to enable debugging for MAC-in-MAC. Use undo debugging minm to disable debugging for MAC-in-MAC. Syntax debugging minm { all | error | event | packet } undo debugging minm { all | error | event | packet } Default Debugging for MAC-in-MAC is disabled.
a. Field b. Description k. Failed to set driver type: l. MINM_DEL m. Interface type is not MINM failed to issue MINM_DEL to the driver. n. This type of interface does not support supported MAC-in-MAC. o. Failed to broadcast p. MINM failed to broadcast the IPC message by VPLS IPC message through VPLS. Table 2 describes the output fields and messages for the debugging minm event command.
Table 4 Output from the debugging minm event command a. Field b.
a. Field b. Description d. MINM succeeded in processing IPC messages X. X indicates the IPC message type: • 0—Invalid operation type. • 1—Adding VSI. • 2—Deleting VSI. • 3—Configuring B-VLAN. • 4—Adding B-VLAN to the driver. • 5—Deleting B-VLAN to the driver. • 6—Deleting uplink port to the driver. • 7—Adding uplink port to the driver. • 8—Deleting uplink port. • 9—Deleting an uplink port by the port number. • 10—Adding uplink port. • 11—Enabling re-encapsulation. • 12—Disabling re-encapsulation.
a. Field b. Description f. e. Succeeded in sending IPC to slot n, message type: X MINM succeeded in sending IPC message X to the board in slot n. n indicates the slot number of the board. X indicates the IPC message type. h. MINM succeeded in processing event Y on port n. n indicates the number of the port. Y indicates the event type: g. Succeeded in processing interface n, Event: Y • 2—Deleting a port. • 8—Unplugging a port. • 64—Port down. j. i.
a. Field b. Description p. Configuring the uplink o. pfDRV_MINM_SetUplink is NULL port is not supported. r. Configuring the re-encapsulation information is not supported. q. pfDRV_MINM_SetReEncapsulation is NULL Table 3 describes the output fields and messages for the debugging minm packet command. Table 5 Output from the debugging minm packet command a. Field b. Description c. Receive MAC-in-MAC d. MINM received MAC-in-MAC frames frame from IFname on port IFname. e. B-DA f. g. B-SA h.
*Oct 24 14:50:31:875 2009 Quidway MINM/7/Event: BMAC already learned. // MINM already learned the B-MAC. # Enable MAC-in-MAC packet debugging. Output similar to the following example is generated when you configure the uplink port and downlink port for MAC-in-MAC.
MBGP debugging commands The output description tables in this document only contain fields and messages that require an explanation. debugging bgp update ipv4 multicast Use debugging bgp update ipv4 multicast to enable BGP update debugging for IPv4-MBGP address family. Use undo debugging bgp update ipv4 to disable BGP update debugging for IPv4-MBGP address family.
Field Description Recv UPDATE(Withdraw) from x.x.x.x BGP received an update withdraw from BGP neighbor x.x.x.x. Error identified while receiving UPDATE message from the peer x.x.x.x and ignored Error was found in the received update message from neighbor x.x.x.x, and the message was ignored. Err/SubEr Error code/sub-error code. Errdata: Error data. Send UPDATE to x.x.x.x BGP sent an update message to BGP neighbor x.x.x.x. Send UPDATE(Withdraw) to peer x.x.x.
Examples # Enable BGP update debugging for IPv4-MBGP address family. debugging bgp update ipv4 multicast packet *Apr 2 17:46:55:830 2007 Sysname-Comware RM/6/RMDEBUG: BGP_MBGP.: Recv UPDATE from 12.1.1.1 with following destinations : Update message length : 67 Local Pref : 100 MED : 0 Origin : Incomplete AS Path : Next Hop : 12.1.1.1 1.2.3.
MFF debugging commands The output description tables in this document only contain fields and messages that require an explanation. debugging mac-forced-forwarding Use debugging mac-forced-forwarding to enable MFF debugging. Use undo debugging mac-forced-forwarding to disable MFF debugging. Syntax debugging mac-forced-forwarding { all | error | event | info | packet } undo debugging mac-forced-forwarding { all | error | event | info | packet } Default MFF debugging is disabled.
Field Description Process event of slot-insert failed MFF failed to process a card insertion event. Create interface control block failed MFF failed to create an interface control block. Delete interface control block failed MFF failed to delete an interface control block. Table 3 describes output fields and messages for the debugging mac-forced-forwarding event command.
Field Description Transmit request from client After the user port received an ARP request from a host and the MAC address of the gateway was not obtained, MFF forwarded the request. Refresh gateway information by packet MFF updated the MAC address of the gateway and the upstream network port marked by the gateway. Self ip address The MFF device did not process the packet with the destination IP address as that of a virtual interface on itself.
*Apr 26 16:30:21:471 2000 Sysname MFF/7/Debug_MFF_Event: MFF Event: Notify MCM ACL rule: Interface name: Ethernet1/3, Option type: ADD, Return Value: 0 // After automatic mode MFF was enabled for VLAN 100, MFF notified MCM to apply an ACL to user port Ethernet 1/3 to deliver ARP packets to the CPU. The apply operation was successful.
debugging mac-forced-forwarding info terminal debugging % Current terminal debugging is on // MFF information debugging was enabled. *Apr 26 17:00:25:371 2000 Sysname MFF/7/Debug_MFF_Info: MFF Info: Get client info from DHCP: Client MAC: 000d-5619-f7bc, Gateway IP: 100.1.1.100, Client IP: 100.1.1.1, Client VLAN: 100, Port: Ethernet1/3 // After automatic mode MFF was enabled, MFF obtained a client entry from the DHCP server. # Enable MFF packet debugging on an MFF enabled device.
Sending MFF packet: Src Interface : N/A Dst Interface : Ethernet1/2 InterfaceType :NETWORK Vlan ID :100 SrcMac :000d-5619-f7bc SrcIp : 100.1.1.1 DstMac :0000-0000-0000 DstIp : 100.1.1.100 PacketType :REQUEST // Network port Ethernet1/2 received an ARP request from the host with IP address 100.1.1.1 and MAC address 000d-5619-f7bc to the gateway at 100.1.1.100.
MLD debugging commands The output description tables in this document only contain fields and messages that require an explanation. debugging mld Use debugging mld to enable MLD debugging. Use undo debugging mld to disable MLD debugging.
Table 10 Output from the debugging mld done command Field Description DONE MLD done message. Interfacename(ifadd) Interface that received the MLD done message (interface address). group gadd IPv6 group address in the MLD done message. Ignoring This MLD done message was ignored. Table 2 describes output fields and messages for the debugging mld event command.
Field Description Record types of MLDv2 membership reports: • • • • • • IS_IN/IS_EX/TO_IN/TO_EX/ALLOW/BLOCK IS_IN IS_EX TO_IN TO_EX ALLOW BLOCK Group gadd Reported IPv6 group address. (sadd, gadd) (S, G) entry. v1/v2 Version of MLD membership report. Interfacename(ifadd) Interface that sent/received this message (interface address). Table 5 describes output fields and messages for the debugging mld query send command.
Field Description Other querier present timeout The MLD other querier present interval timer timed out. Interfacename(ifadd) Interface that sent/received this message. The interface address is displayed in the brackets. Deleting v1 host timer The MLDv1 host timer timed out. Setting v1 host timer MLDv1 host present timer was configured. Examples # Enable MLD done message debugging. When MLD is enabled, output similar to the following example is generated: debugging mld done *0.
*0.1223796 Sysname MLD/7/EVENT:Enqueue group(FF0E::101:101) on interface Ethernet1/1(FE80::200:5EFF:FE01:6C00) in group_calq. (G014076) // MLD received an MLD done message on Ethernet 1/1 and reset the group aging timer. *0.1224808 Sysname MLD/7/EVENT:Lmqi timeout for group(FF0E::101:101), sending last listener query on interface Ethernet1/1(FE80::200:5EFF:FE01:6C00). (G013428) *0.1224808 Sysname MLD/7/EVENT:Enqueue group(FF0E::101:101) on interface Ethernet1/1(FE80::200:5EFF:FE01:6C00) in group_calq.
*0.20301209 Sysname MLD/7/SSM-MAPPING:(public net):Receive ssm-mapping report for group FF34::1 on interface Ethernet1/1(FE80::200:5EFF:FE01:6C00) (M053895) // MLD received an MLDv1 membership report with the multicast group address FF34::1 on Ethernet 1/1. The multicast group address is in the MLD SSM mapping rule range. *0.
Syntax debugging mld proxying { event | packet | routing-table } advanced-acl6-number undo debugging mld proxying { event | packet | routing-table } Default MLD proxy debugging is disabled. Views User view Default command level 1: Monitor level Parameters event: Specifies MLD proxy event debugging. packet: Specifies MLD proxy packet debugging. routing table: Specifies MLD proxy routing table debugging. advanced-acl6-number: Specifies an IPv6 advanced ACL by its number, in the range of 3000 to 3999.
Field Description type 1 Group record types: • • • • • • • • type 2 type 3 type 4 type 5 type 6 type 7 type 8 Type 1—IS_IN. Type 2—IS_EX. Type 3—TO_IN. Type 4—TO_EX. Type 5—ALLOW. Type 6—BLOCK. Type 7—JOIN. Type 8—LEAVE. Table 10 describes output fields and messages for the debugging mld proxying routing-table command. Table 19 Output from the debugging mld proxying routing-table command Field Description (sadd, gad) (S, G) entry. Recovery of route The route was recovered.
# Enable MLD proxy packet debugging on the public network. When MLD proxy is enabled on the interface, output similar to the following example is generated: debugging mld proxying packet *0.1726142 Sysname MLD/7/PRY_EVT: Received MLDv1 query for group FF0E::101:101 on version 1 proxying interface Ethernet1/1(FE80::200:6C00). (G362885) // MLD received an MLDv1 query message for group FF0E::101:101 on the upstream interface Ethernet 1/1. *0.
MLD snooping debugging commands The MCS module name is identified as "multicast" in debugging messages. The output description tables in this document only contain fields and messages that require an explanation. Some information in this chapter is device type-specific. Devices in this chapter are categorized depending on their IRF capability and support for interface cards that use independent processors for forwarding traffic, as shown in Table 1.
Views User view Default command level 1: Monitor level Parameters abnormal: Specifies MLD snooping exception debugging. all: Specifies all types of MLD snooping debugging. driver: Specifies MLD snooping interface driver debugging. event: Specifies MLD snooping event debugging. group: Specifies MLD snooping multicast group debugging. ipc { receive | send }: Specifies inbound/outbound IPC packet debugging. packet: Specifies MLD snooping packet debugging.
Table 3 describes output fields and messages for the debugging mld-snooping event command. Table 22 Output from the debugging mld-snooping event command Field Description Succeed to enable/disable MLD snooping globally MLD snooping was globally enabled or disabled. Succeed to enable/disable MLD snooping drop-unknown globally The function of dropping unknown multicast packets was globally enabled or disabled.
Table 7 describes output fields and messages for the debugging mld-snooping timer command. Table 26 Output from the debugging mld-snooping timer command Field Description Create/Set MLD snooping created or set a timer.
*Nov 7 17:06:08:412 2006 Sysname MCS/7/ipcsend:Inform other boards: this board is a new router board. (G143331) // MLD snooping sent an IPC packet. # Enable MLD snooping packet debugging. When MLD snooping is enabled on the device, output similar to the following example is generated: debugging mld-snooping packet *Nov 7 09:37:21:174 2006 Sysname MCS/7/packet:Received MLDv2 report packet for destination address FF02::16 from port Eth1/1 on vlan 2.
Modem debugging commands The output description tables in this document only contain fields and messages that require an explanation. debugging modem Use debugging modem to enable modem debugging. Use undo debugging modem to disable modem debugging.
Field Description MDM_LINE_MODEM_OUT Placing calls was enabled. MDM_LINE_MODEM_INOUT Both answering calls and placing calls were enabled. MDM_LINE_DISCONNECT Modem was disconnected. MDM_LINE_CALLBACK Modem callback. MDM_DDR_CONN_REQ DDR connection request was received. MDM_DDR_CONN_RES DDR connection acknowledgement was received. MDM_DDR_DISC_REQ DDR disconnect request was received. MDM_DDR_DISC_RES DDR disconnect acknowledgement was received. MDM_PHY_SHUT SHUT command was issued.
dialer number 106 # user-interface tty 177 modem both # # Enable modem debugging on Router A, and then ping Router B from Router A. debugging modem interface Analogmodem 5/1 ping -c 1 51.0.0.2 *Mar 31 12:13:00:352 2006 Sysname MODEM/7/debug_CTRL: Analogmodem5/1 Modem received information: MDM_DDR_CONN_REQ // Analogmodem 5/1 received a connection request.
// Analogmodem 5/1 changed from disconnect state to idle state. *Mar 31 12:13:35:750 2006 Sysname MODEM/7/debug_ModemState: Analogmodem5/1 The modem state is changed: from IDLE to DISCONNECT // Analogmodem 5/1 changed from idle state to disconnect state. *Mar 31 12:13:35:750 2006 Sysname MODEM/7/debug_AT_Send: Analogmodem5/1 Data of AT is sent: +++ // Analogmodem 5/1 issued a command to terminate the connection.
Monitor Link debugging commands The Monitor Link module name is identified as "MTLK" in debugging messages. debugging monitor-link Use debugging monitor-link to enable Monitor Link debugging. Use undo debugging monitor-link to disable Monitor Link debugging. Syntax debugging monitor-link [ group group-id ] { all | error | event } undo debugging monitor-link [ group group-id ] { all | error | event } Default Monitor link debugging is disabled.
MPLS L2VPN debugging commands The output description tables in this document only contain fields and messages that require an explanation. debugging mpls l2vpn Use debugging mpls l2vpn to enable debugging for MPLS L2VPN. Use undo debugging mpls l2vpn to disable debugging for MPLS L2VPN. Syntax debugging mpls l2vpn { advertisement | all | connections | error | event | hsb } undo debugging mpls l2vpn { advertisement | all | connections | error | event | hsb } Default Debugging for MPLS L2VPN is disabled.
Field Description MP_REACH_NLRI Network layer reachable message. MP_UNREACH_NLRI Network layer unreachable message. Table 2 describes output fields and messages for the debugging mpls l2vpn event command. Table 29 Output from the debugging mpls l2vpn event command Field Description g_ulL2vpnMsg2MFWCounter L2VPN advertised counter to MFW. g_ulL2vpnMsg2BGPCounter L2VPN advertised counter to BGP. g_ulL2vpnMsg2LDPCounter L2VPN advertised counter to LDP.
Table 31 Output from the debugging mpls l2vpn connection command Field Description RmtCEID Remote CE identifier. vcid VC identifier. vctype VC type. dest Destination LSR address. Table 5 describes output fields and messages for the debugging mpls l2vpn error command. Table 32 Output from the debugging mpls l2vpn error command Field Description Invalid Remote interface - not able to get the outifindex Invalid remote interface. Not able to get the outgoing interface index.
peer pe ip address is: 33.33.33.33 request_id is: 0 label is: 1024 status_code is: 0x0 fec element type is: 128 c-Bit is: 0 vc type is: ethernet vc info length is: 4 group id is: 0 vc id is: 100 length of vc_fec_tlv is: 12 context of vc_fec_tlv is: 80 00 05 04 00 00 00 00 00 00 00 64 *0.3799203 PE1 L2V/8/DBG: ! L2VPN LDP - Send LABEL WITHDRAW to ldp success // L2VPN sent a label withdraw message to LDP successfully. *0.
group id is: 0 vsi id is: 100 length of vc_fec_tlv is: 12 context of vc_fec_tlv is: 80 00 05 04 00 00 00 00 00 00 00 64 // The VSI at the private network side received the label release message. *0.3799422 PE1 L2V/8/DBG: ! L2VPN LDP no corresponding local vc // L2VPN LDP had no corresponding local VC. *0.3799422 PE1 L2V/8/DBG: ! L2VPN VSI no local ldp peer found. // L2VPN VSI had no local LDP peer found. # Enable debugging for MPLS L2VPN connections.
%Jul 6 17:31:42:812 2006 PE1 IFNET/5/LINK UPDOWN: Vlan-interface80: link status is UP [PE1-Vlan-interface80] [PE1-Vlan-interface80] [PE1-Vlan-interface80] [PE1-Vlan-interface80] [PE1-Vlan-interface80] interface vlan-interface 10 [PE1-Vlan-interface10] display this # interface Vlan-interface10 ip address 100.1.1.1 255.255.255.0 mpls mpls ldp # return [PE1-Vlan-interface10] undo mpls [PE1-Vlan-interface10] #Jul 6 17:32:16:469 2006 PE1 LDP/5/SessionDown: Session(22.22.22.22:0.
100 Vlan-interface80 up 1024 1024 default [PE1]dis debug MPLS L2VPN event debugging is on [PE1] interface vlan-interface 80 [PE1-Vlan-interface80] shutdown [PE1-Vlan-interface80] %Jul 10 10:01:54:640 2006 PE1 IFNET/5/LINK UPDOWN: Vlan-interface80: link status is DOWN *0.1196640 PE1 L2V/8/DBG: ! L2VPN - interface status change event received: interface Vlan-interface80 down // L2VPN received interface status change event that interface VLAN-interface 80 was down. *0.
• Execute the debugging mpls l2vpn event command on one PE router. • Shut down the interface that is connected to the private network. [PE1] interface vlan-interface 80 [PE1-Vlan-interface80] [PE1-Vlan-interface80] [PE1-Vlan-interface80] display this # interface Vlan-interface80 shutdown ip address 100.5.1.2 255.255.255.0 mpls l2vc 33.33.33.
// L2VPN interface encapsulation restore finished. *0.1686906 PE1 L2V/8/DBG:Slot=7; L2VPN Parse Restore Buffer....leaving // L2VPN parse restore buffer finished. *0.1686922 PE1 L2V/8/DBG:Slot=7; L2VPN Restore Buffer....leaving // L2VPN restore buffer finished. *0.1686922 PE1 L2V/8/DBG:Slot=7; L2VPN Restore Scheduler....leaving // L2VPN restore buffer finished. *0.1686922 PE1 L2V/8/DBG:Slot=7; L2VPN Restore Scheduler....entered // L2VPN restore began. *0.
MPLS L3VPN debugging commands The output description tables in this document only contain fields and messages that require an explanation. debugging l3vpn Use debugging l3vpn to enable debugging for L3VPN. Use undo debugging l3vpn to disable debugging for L3VPN. Syntax debugging l3vpn { all | hsb | cfgmsg } undo debugging l3vpn { all | hsb | cfgmsg } Default The debugging for L3VPN is disabled.
Field Description L3VPN VRFMGM DeleteDesc....entered L3VPN began to delete the description of the current VPN instance. L3VPN VRFMGM DeleteDesc....leaving L3VPN deleted the description of the current VPN instance. L3VPN VRFMGM Import Route Policy Assign....entered L3VPN began to assign an import route policy. L3VPN VRFMGM Import Route Policy Assign....leaving L3VPN finished assigning an import route policy. L3VPN VRFMGM MaxRoute....
Field Description L3VPN CORE Get Batch BackUp Data....entered L3VPN began to get batch backup data. L3VPN CORE Get Batch BackUp Data....leaving L3VPN finished getting batch backup data. PackOneBatchVrf....entered L3VPN began to get a batch of VRFs. PackOneBatchVrf....leaving L3VPN finished getting a batch of VRFs. PackOneVrf....entered L3VPN began to get one VRF. PackOneVrf....leaving L3VPN finished getting one VRF.
VPN-Target assignment is successful *0.1669656 Sysname L3VPN/8/L3VPNDBG: L3VPN VRFMGM RtList Assign....entered // L3VPN began to assign VPN targets. *0.1669656 Sysname L3VPN/8/L3VPNDBG: L3VPN VRFMGM RtList Assign....leaving // L3VPN finished assigning VPN targets. *0.1669656 Sysname L3VPN/8/L3VPNDBG: L3VPN VRFMGM RtList Assign....entered // L3VPN began to assign VPN target. *0.1669656 Sysname L3VPN/8/L3VPNDBG: L3VPN VRFMGM RtList Assign....leaving // L3VPN finished assigning VPN target.
*0.2806641 Sysname L3VPN/8/L3VPNDBG: L3VPN VRFMGM Tunnel Policy Assign....entered // L3VPN began to assign tunnel policy. *0.2806641 Sysname L3VPN/8/L3VPNDBG: L3VPN VRFMGM Tunnel Policy Assign....leaving // L3VPN finished assigning tunnel policy. [Sysname-vpn-instance-vpna]export route-policy erp1 Policy configuration is successful, but needs to be created *0.2118578 Sysname L3VPN/8/L3VPNDBG: L3VPN VRFMGM Export Route Policy Assign....entered // L3VPN began to assign export route policy. *0.
MPLS OAM debugging commands The output description tables in this document only contain fields and messages that require an explanation. debugging mpls oam CAUTION: Executing this debugging command might affect sending and receiving of MPLS OAM protocol packets. Use this command only when necessary. Use debugging mpls oam to enable one or all types of debugging for MPLS OAM. Use undo debugging mpls oam to disable MPLS OAM debugging.
packet: Specifies debugging for packets. process: Specifies debugging for processing. timer: Specifies debugging for timers. Usage guidelines Table 1 describes the output fields and messages for the debugging mpls oam bdi command. Table 34 Output from the debugging mpls oam bdi command Field Description OAM Index OAM instance index. OAM DD OAM defect detection. Table 2 describes the output fields and messages for the debugging mpls oam cv command.
Field Description tunnel id Tunnel ID in the TTSI. ASM OAM state machine. ext-bdi Extended BDI, used for RLSN. available available state of the state machine. unavailable unavailable state of the state machine. RLSN Remote link status notification. Table 5 describes the output fields and messages for the debugging mpls oam error command. Table 38 Output from the debugging mpls oam error command Field Description OAM Index OAM instance index.
Table 9 describes the output fields and messages for the debugging mpls oam hsb command. Table 42 Output from the debugging mpls oam hsb command Field Description OAM Index OAM instance index. status HA state. ha type Type of the HA event. Table 10 describes the output fields and messages for the debugging mpls oam main command. Table 43 Output from the debugging mpls oam main command Field Description OAM Index OAM instance index. MPLS OAM MN Main debugging of MPLS OAM.
Table 45 Output from the debugging mpls oam process command Field Description OAM Index OAM instance index. release oam OAM sent the OAM instance to the main processing board. update entry config OAM updated the OAM instance configuration. Table 13 describes the output fields and messages for the debugging mpls oam timer command. Table 46 Output from the debugging mpls oam timer command Field Description ASM ava2unava timer available state timer of the OAM state machine.
*Nov 29 16:01:18:125 2006 PE1 OAM/7/PROCESS: 17:4881: Begin to release oam! // OAM started to send the OAM instance to the main processing board. *Nov 29 16:01:18:125 2006 PE1 OAM/7/PROCESS: 17:9258: GetProcBoard:begin to select process board *Nov 29 16:01:18:146 2006 PE1 OAM/7/PROCESS: 17:9474: SelAgtBoard process start // OAM started to select the main processing board.
*Nov 29 16:01:18:847 2006 PE1 OAM/7/PROCESS:Slot=1; 17:2649: begin to add search node *Nov 29 16:01:18:847 2006 PE1 OAM/7/PROCESS:Slot=1; 17:2671: begin to select which search node to add *Nov 29 16:01:18:847 2006 PE1 OAM/7/PROCESS:Slot=1; 17:2694: oam proc:Add ttsi node at ingress *Nov 29 16:01:18:864 2006 PE1 OAM/7/PROCESS:Slot=1; 17:2897: begin to add ttsi node *Nov 29 16:01:18:879 2006 PE1 OAM/7/PROCESS:Slot=1; 17:2916: sucess to memory alloc for ttsi node *Nov 29 16:01:18:879 2006 PE1 OAM/7/PROCESS:Slo
MPLS TE debugging commands The output description tables in this document only contain fields and messages that require an explanation. debugging isis traffic-eng Use debugging isis traffic-eng to enable debugging for IS-IS traffic engineering. Use undo debugging isis traffic-eng to disable debugging for IS-IS traffic engineering.
Default Debugging for MOAM is disabled. Views User view Default command level 1: Monitor level Examples # Enable debugging for MOAM packets. Use the moam lm command to detect the packet loss rates for a bidirectional MPLS TE tunnel on the device. debugging mpls moam packet moam lm -c 1 te tunnel 2 Loss measurement for Tunnel 2, press CTRL_C to break *Jan 30 16:46:36:781 2011 Sysname MOAM/7/Packet: >>>>Send LM query msg. Sequence number: 0 // MOAM sent an LM request message.
Syntax debugging mpls rsvp-te { all | authentication | bundle | encdec | error | hello | hsb | main | msg-hex | path | perr | ptear | rconf | rerr | resv | rtear | socket | srefresh | timer | tool | traffic-control | tunnel-id { tunnel-id | all } } undo debugging mpls rsvp-te { all | authentication | bundle | encdec | error | hello | hsb | main | msg-hex | path | perr | ptear | rconf | rerr | resv | rtear | socket | srefresh | timer | tool | traffic-control | tunnel-id { tunnel-id | all } } Default Debuggi
Usage guidelines For the completeness of debugging information, H3C recommends that you enable debugging mpls rsvp-te tunnel-id for each type of RSVP-TE debugging except for debugging mpls rsvp-te all. Table 1 describes output fields and messages for the debugging mpls rsvp authentication command. Table 47 Output from the debugging mpls rsvp authentication command Field Description Local IfEntry number is x. The local RSVP-TE interface sequence number is X.
Field Description Unable to add PSB in IfEntry link MPLS TE was unable to add PSB to the RSVP-TE interface information. Table 7 describes output fields and messages for the debugging mpls rsvp ptear command. Table 53 Output from the debugging mpls rsvp ptear command Field Description TearRSB by OutIf filter is Null, Send PathTear Msg When processing TearRSB by outbound interface, MPLS TE found the filter is null and sent a PathTear message.
# Enable the RSVP-TE Hello function in MPLS view and interface view. Execute both the debugging mpls rsvp-te hello and debugging mpls rsvp-te tunnel-id all commands. Then the two devices establish an MPLS TE tunnel. debugging mpls rsvp-te hello debugging mpls rsvp-te tunnel-id all *Nov 13 10:39:00:618 2006 Sysname RSVP/7/HELLO: 10:0353: Receiving Hello REQ Message form 80.1.1.2: // RSVP received a Hello REQ message from 80.1.1.2.
*Nov 13 11:39:19:146 2006 Sysname RSVP/7/PERR: 06:0581: Start PathErr message processing... // RSVP started to send a PathErr message. *Nov 13 11:39:19:146 2006 Sysname RSVP/7/PERR: 06:0583: End PathErr message process. // RSVP finished sending the PathErr message. # Execute both the debugging mpls rsvp-te ptear and debugging mpls rsvp-te tunnel-id all commands, and then delete the tunnel.
*Nov 13 11:55:29:990 2006 Sysname RSVP/7/RESV: 19:0727: Update Old RSB! // RSVP updated the old RSB. *Nov 13 11:55:29:990 2006 Sysname RSVP/7/RESV: 19:0764: message bandwidth: 0 // The bandwidth request carried by the message is 0. *Nov 13 11:55:29:990 2006 Sysname RSVP/7/RESV: 19:0778: LSPID: 6 // The LSP ID is 6. *Nov 13 11:55:29:990 2006 Sysname RSVP/7/RESV: 19:0783: end display LSP ID // RSVP finished displaying LSP ID.
Syntax debugging mpls te cspf { all | computation | errors | events | tedb } undo debugging mpls te cspf { all | computation | errors | events | tedb } Default Debugging for CSPF is disabled. Views User view Default command level 1: Monitor level Parameters all: Specifies all types of debugging for MPLS TE CSPF. computation: Specifies debugging for CSPF calculation. error: Specifies debugging for errors. event: Specifies debugging for events.
01:7278: The resource reserve policy is LSPM_RANDOM_FILL. // The resource reservation policy is LSPM_RANDOM_FILL. *Sep 22 02:20:20:397 2003 Sysname CSPF/7/COMPUTE: 01:6670: Beginning the first segment computation. // The first segment computation started. *Sep 22 02:20:20:517 2003 Sysname CSPF/7/COMPUTE: 01:6710: The current IGP is OSPF and the process id is 1. // The current IGP protocol is OSPF, and the process ID is 1.
*Sep 22 02:20:22:517 2003 Sysname CSPF/7/COMPUTE: 01:7493: The computation of path to egress is finished. // Computation of the path to the egress has been finished. # Configure MPLS basic capability and MPLS TE basic capability on two directly-connected devices. Execute the debugging mpls te cspf events command. Establish OSPF neighbor relationship between the two devices, and configure CSPF. debugging mpls te cspf events *Sep 22 02:31:58:656 2003 Sysname CSPF/7/EVENT: 05:0600: Received 87.1.1.
*Sep 22 02:37:58:794 2003 Sysname CSPF/7/TEDB: 02:1872: Router Node for 11.11.11.11 has been added successfully. // CSPF added the router node 11.11.11.11. *Sep 22 02:37:58:934 2003 Sysname CSPF/7/TEDB: 02:1042: Area Id 0 added successfully to area id list of router node. // CSPF added area ID 0 to the area ID list of the router node. *Sep 22 02:37:59:74 2003 Sysname CSPF/7/TEDB: 02:1089: Link Index added successfully to Link Index list of router node.
02:0170: Router node index added successfully to node hash table. // CSPF added the router node index to the node's hash table. *Sep 22 02:38:00:924 2003 Sysname CSPF/7/TEDB: 02:2749: 87.1.1.2 has been added successfully to link table. // CSPF added link 87.1.1.2 to the link table. *Sep 22 02:38:01:55 2003 Sysname CSPF/7/TEDB: 02:3701: IGP received link info has been processed successfully. // CSPF processed the IGP link information successfully.
// CSPF added link 87.1.1.2 to the link table. *Sep 22 02:38:02:904 2003 Sysname CSPF/7/TEDB: 02:3701: IGP received link info has been processed successfully. // CSPF processed the IGP link information successfully. *Sep 22 02:38:03:44 2003 Sysname CSPF/7/TEDB: 02:3284: Network LSA for 87.1.1.2 has been modified successfully. // CSPF modified the network LSA for 87.1.1.2. *Sep 22 02:38:03:184 2003 Sysname CSPF/7/TEDB: 02:3799: IGP received network LSA has been processed successfully.
Default command level 1: Monitor level Parameters all: Specifies all types of debugging for MPLS TE management. auto-bandwidth-adjustment: Specifies debugging for auto-bandwidth-adjustment of MPLS TE management. events: Specifies debugging for MPLS TE management events. fast-reroute: Specifies debugging for fast reroute of MPLS TE management. link-administration: Specifies debugging for link administration of MPLS TE management. reoptimization: Specifies debugging for reoptimization of MPLS TE management.
*Nov 13 14:24:56:848 2006 Sysname LSPM/7/LSPM TE EVENTS: Main Crlsp is Up for Tunnel : Tunnel0. // The main CR-LSP for Tunnel 0 is up. # Execute the debugging mpls te management fast-reroute command. Then the two devices establish an RSVP-TE tunnel. debugging mpls te management fast-reroute *Nov 13 14:28:10:424 2006 Sysname LSPM/7/LSPM TE FRR: The interface has been added for bypass tunnel (Tunnel1) to protect.
*Nov 13 14:42:35:130 2006 Sysname LSPM/7/LSPM TE STATES: State Change :Tunnel Tunnel1 enters READY state from SETUPING state. // State change: Tunnel 1 entered the READY state from the SETUPING state. debugging mpls te protect-switch Use debugging mpls te protect-switch to enable debugging for protection switching. Use undo debugging mpls te protect-switch to disable debugging for protection switching.
Old event: Working path flag: 1 Protection path flag: 1 Switch result: 0 Message: 0x0(0,0) --------before processing------------- // The protection group was enabled to process the event. This is the protection group's status before processing. *Feb 22 16:52:53:969 2011 PE1 PSC/7/PROC: Real-time back up: PG 1, WTnlId 79101954, PTnlId 4294967295, Action 1. // Status changed. The device performed real-time backup for the protection group.
Examples # Enable OSPF TE debugging.
MSDP debugging commands Support for VPN instances depends on your device model. The output description tables in this document only contain fields and messages that require an explanation. debugging msdp Use debugging msdp to enable MSDP debugging. Use undo debugging msdp to disable MSDP debugging.
Table 58 Output from the debugging msdp event command Field Description (sadd, gadd) (S, G) entry. static RPF peer RPF neighbor types: E-MBGP peer I-MBGP peer NOT BGP peer NOT MBGP peer • • • • • Static RPF peer E-MBGP peer I-MBGP peer NOT BGP peer NOT MBGP peer Table 2 describes output fields and messages for the debugging msdp packet command.
*Aug 25 09:35:45:790 2006 ar2 MSDP/7/EVENT: (public net):11.11.11.11: TCP connection established (H12854) // A TCP connection was established. *Aug 25 09:35:45:790 2006 ar2 MSDP/7/EVENT: (public net):11.11.11.11: Sending message to peer: keepalive (H101045) // The device sent keepalive messages to the MSDP peer. *Aug 25 09:35:45:790 2006 ar2 MSDP/7/EVENT: (public net):11.11.11.11: Originating SA message for peer (H10859) // The device sent SA messages (if any) to the MSDP peer.
MTR debugging commands Enabling any debugging command in this chapter might affect system performance, especially when the system is busy. Disable debugging after the debugging operation is complete. debugging multiple-topology event Use debugging multiple-topology event to enable topology event debugging. Use undo debugging multiple-topology event to disable topology event debugging.
Examples # Enable topology hot backup debugging. When you create topology voice, output similar to the following example is generated: debugging multiple-topology hsb [Sysname-address-family ipv4] multiple-topology voice *Jul 20 11:44:17:282 2009 Sysname MT/7/MTDBG: rtbkup:send type:1's data // MTR sent information with a backup type of create to the standby card.
Multicast routing and forwarding debugging commands Support for VPN instances depends on your device model. The output description tables in this document only contain fields and messages that require an explanation. Some information in this chapter is device type specific. Devices in this chapter are categorized depending on their IRF capability and support for interface cards that use independent processors for forwarding traffic, as shown in Table 1.
undo debugging mfib [ all-instance | vpn-instance vpn-instance-name ] { all | { driver | no-cache | packet | register | route | sync | upcall | wrong-iif } [ advanced-acl-number ] } [ slot slot-number ] Distributed IRF devices: debugging mfib [ all-instance | vpn-instance vpn-instance-name ] { all | { driver | no-cache | packet | register | route | sync | upcall | wrong-iif } [ advanced-acl-number ] } [ chassis chassis-number slot slot-number ] undo debugging mfib [ all-instance | vpn-instance vpn-instance-
Table 62 Output from the debugging mfib driver command Field Description call driver The MFIB called the driver. Do not add to driver The MFIB did not add the multicast forwarding entries to the driver. downloaded to driver Failed The MFIB failed to issue configurations to the driver. (sadd, gadd) (S, G) entry. set unknown packet to CPU The MFIB sent unknown packets to the CPU for process. Table 3 describes output fields and messages for the debugging mfib no-cache command.
Table 65 Output from the debugging mfib register command Field Description Send register The MFIB sent a register message. (sadd, gadd) (S, G) entry. Dropping received register packet The MFIB dropped error register messages. Table 6 describes output fields and messages for the debugging mfib route command. Table 66 Output from the debugging mfib route command Field Description add-entry message The MFIB received an add-entry message from the multicast routing module (MRM).
Field Description (sadd, gadd) (S, G) entry. Table 9 describes output fields and messages for the debugging mfib wrong-iif command. Table 69 Output from the debugging mfib wrong-iif command Field Description WRONG_IF packet The MFIB received a multicast data packet on a wrong incoming interface. (sadd, gadd) (S, G) entry. Examples • On multi-core devices: # Enable MFIB packet debugging for the public network.
# Enable MFIB route debugging for the public network. When PIM-DM is enabled on interfaces, output similar to the following example is generated: debugging mfib route *Nov 12 17:43:01:491 2007 Sysname MFIB/7/MFIB ROUTE: (public net):Receive no cache report,add dummy entry (3.4.5.6, 226.1.1.1)(A07109) *Nov 12 17:43:01:492 2007 Sysname MFIB/7/MFIB ROUTE: (public net):Entry (3.4.5.6, 226.1.1.
NOTE: A router does not output interface driver debugging information about MFIB. # Enable MFIB unknown packet debugging for the public network. When PIM-DM is enabled on interfaces, output similar to the following example is generated: debugging mfib no-cache *Apr 26 12:43:19:09 2000 Sysname MFIB/7/MFIB NO-CACHE: (public net):No MFIB entry matches (3.4.5.6, 226.1.1.1)(A08303) *Apr 26 12:43:19:17 2000 Sysname MFIB/7/MFIB NO-CACHE: (public net):Receive no cache report,add dummy entry (3.4.5.
*Apr 26 13:29:33:753 2000 Sysname MFIB/7/MFIB REGISTER: (public net):Received register packet from 22.1.1.1 to 10.1.1.1, with data packet: (22.1.1.10, 226.1.1.1)(A086218) // The MFIB received a register message (22.1.1.1, 10.1.1.1) with the encapsulated multicast packet (22.1.1.10, 226.1.1.1). *Apr 26 13:29:33:763 2000 Sysname MFIB/7/MFIB REGISTER: (public net):Send register-stop packet to 22.1.1.1 for (22.1.1.10, 226.1.1.1).(A085970) // The MFIB sent a register-stop message for (22.1.1.10, 226.1.1.
PIM-DM is enabled on VLAN-interface 40 and VLAN-interface 60. Packets with the same multicast source address and multicast group address are sent to the two interfaces. debugging mfib wrong-iif *Jan 24 04:36:52:990 2003 Sysname MFIB/7/MFIB WRONG-IIF: (public net):Slot=3;WRONG_IF packet (10.11.113.168, 226.1.1.1) received on Vlan-interface60, should from Vlan-interface40(A08734) // The MFIB received a multicast packet (10.11.113.168, 226.1.1.
Table 70 Output from the debugging mrm event command Field Description (sadd, gadd) (S, G) entry. failed Operation failed. Table 11 describes output fields and messages for the debugging mrm packet command. Table 71 Output from the debugging mrm packet command Field Description Received Received packets. MFIB information(NOCACHE) Types of received packets: MFIB information(WRONGIF) packet (protocol = 2) • • • • • • • • • (sadd, gadd) (S, G) entry.
*0.21838588 Sysname MRM/7/PACKET: (public net):Received MFIB information(NOCACHE) for (1.1.1.108, 235.1.1.1) with incoming interface index 0x30f0188(C22380) // The MRM received a multicast packet (1.1.1.108, 235.1.1.1) for an unknown group address from the MFIB on the interface with the index number of 0x30F0188. *0.22048588 Sysname MRM/7/PACKET: (public net):Received MFIB information(INACTIVE) for (1.1.1.108, 235.1.1.1) (C22502) // The multicast forwarding entry of (1.1.1.108, 235.1.1.
Usage guidelines Table 13 describes output fields and messages for the debugging mtracert event command. Table 73 Output from the debugging mtracert event command Field Description task send buffer Buffer for sending task. Maxhops Maximum number of hops. Rttl TTL value of the multicast traceroute packet header. Multicast-enabled Enable IP multicast routing. Responder Address of the responder. Ip_chPr Protocol field in the IP packet header.
Multicast VPN debugging commands The output description tables in this document only contain fields and messages that require an explanation. debugging md Use debugging md to enable multicast domain (MD) debugging. Use undo debugging md to disable MD debugging.
Table 75 Output from the debugging md event command Field Description local MDT info Local MDT route information. sender Sender of the MDT switching notification. source list List of senders of MDT switching notifications. Pending node Node with a pending join. Join Pending Job Job that processes a pending join. switch receive table Table was created after a switching notification message was received.
Field Description SwitchReceiverTimer Timer for receiving MDT switching notification. IFC_ADD event Interface adding event. IFC_UP event Interface up event. IFC_DELETE event Interface deletion event. Table 2 describes output fields and messages for the debugging md packet command. Table 76 Output from the debugging md packet command Field Description Switch notification message MDT switching notification message. Table 3 describes output fields and messages for the debugging md timer command.
// After MTI got up, an up event was received. BGP was informed to add local MDT routing information. *Jun 16 08:21:50:706 2008 Sysname MD/7/MD:(mvpn): Send Join Group 225.1.2.3 to PD for InstanceID 1(M04882) *Jun 16 08:21:50:706 2008 Sysname MD/7/MD:(mvpn): Socket initialization is successful for MTunnel0(12.34.56.78)(M04661) *Jun 16 08:21:50:707 2008 Sysname MD/7/MD:(mvpn): PIM Initialization on MTI is done successfuly for Instance 1(M04922) // PIM-enabled interfaces exist in the VPN instance.
Default command level 1: Monitor level Parameters all: Specifies all types of multicast tunnel debugging. error: Specifies multicast tunnel error debugging. event: Specifies multicast tunnel event debugging. ipc: Specifies multicast tunnel IPC message debugging. management: Specifies multicast tunnel management debugging. packet: Specifies multicast tunnel packet debugging. Usage guidelines Table 4 describes output fields and messages for the debugging mtunnel error command.
Table 79 Output from the debugging mtunnel event command Field Description The block chain is NULL The global chain of MT data block is null. SplImp is failed The multicast tunnel failed to disable interruption. the DrvContext[0] is 0x DrvContext[0] value of the MPU. the DrvContext[1] is 0x DrvContext[1] value of the MPU. the DrvContext[0] from DRV is 0x DrvContext[0] value the MPU obtained from the driver. the DrvContext[1] from DRV is 0x DrvContext[1] value the MPU obtained from the driver.
Table 81 Output from the debugging mtunnel management command Field Description Can't get MTunnel src addr The MTI source address cannot be obtained. MTunnel src addr is invalid The obtained MTI source address is invalid (0). Can't get MTunnel dest address The group IP address of the MTI cannot be obtained. MTunnel dest addr is invalid The obtained group IP address of the MTI is invalid (0). The MTunnel has been MT state: Up or down. MTunnel Src addr MTI source address.
Examples A multicast tunnel interface (MTI) is a global interface. Unless otherwise stated, all examples in this section are based on centralized devices. # Enable multicast tunnel error debugging. Output similar to the following example is generated when an IPv4 packet of another multicast tunnel is sent under the following conditions: • A multicast tunnel is created between two PE devices. • The tunnel parameters are configured at both ends to bring the tunnel interface up.
*Jan 23 15:52:15:02 2007 Sysname MTUNNEL/7/debug: mgre_encapsulate: Src addr 11.11.11.11. // The multicast tunnel source address 11.11.11.11 is used for packet encapsulation. *Jan 23 15:52:15:02 2007 Sysname MTUNNEL/7/debug: mgre_encapsulate: Grp addr 235.0.0.1. // The default group IP address 235.0.0.1 of the multicast tunnel is used for packet encapsulation. *Jan 23 15:52:15:02 2007 Sysname MTUNNEL/7/debug: mgre_encapsulate: Encapsulate successfully. // The packet was successfully encapsulated.
MVRP debugging commands The output description tables in this document only contain fields and messages that require an explanation. debugging mvrp error Use debugging mvrp error to enable MVRP error debugging. Use undo debugging mvrp error to disable MVRP debugging. Syntax debugging mvrp error undo debugging mvrp error Default MVRP error debugging is disabled. Views Use view Default command level 1: Monitor level Examples # Enable MVRP error debugging.
Examples # Enable MVRP event debugging. debugging mvrp event *Mar 31 17:49:26:219 2011 Sysname MVRP/7/MVRP_DEBUG: EVENT: VLAN list successfully created when the OP timed out. *Mar 31 17:49:26:219 2011 Sysname MVRP/7/MVRP_DEBUG: EVENT: VLAN list added to the trunk port. // Creating VLAN 10 on the remote interface triggered the process of adding the VLAN list on the local interface to the trunk port. debugging mvrp packet Use debugging mvrp packet to enable MVRP packet debugging on an interface.
Examples # Enable debugging for sent MVRP packets on Ethernet 1/1. debugging mvrp packet send interface ethernet 1/1 *Mar 31 17:23:59:860 2011 Sysname MVRP/7/MVRP_DEBUG: PACKET.Ethernet1/1.TX: // MVRP sent packets through Ethernet 1/1. VLAN Attribute = JoinIn, VLAN ID = 1. // The VLAN ID was 1 and the attribute value was JoinIn. debugging mvrp state Use debugging mvrp state interface to enable MVRP state debugging for a VLAN on an interface. Use undo debugging mvrp state to restore the default.
Field Description Application state machine, which indicates the state of the attribute that the local participant declares to the remote participant. The state can be VO, VP, VN, AN, AA, QA, LA, AO, QO, AP, QP, or LO. Each state consists of two letters. The first letter indicates the state: • • • • APP V—Very anxious. A—Anxious. Q—Quiet. L—Leaving. The second letter indicates the membership state: • • • • A—Active member. P—Passive member. O—Observer. N—New.
Field Description Event that triggers state machine transitions. The application state machines include: • Begin!—The state machine is initialized. • New!—MRP requests the local participant to declare this attribute, and the tcDetected timer of the instance on the local participant is not 0. • Join!—MRP requests the local participant to declare this attribute. • Lv!—MRP requests the local participant to deregister this attribute. • rNew!—The local participant receives a New message.
Field Description LeaveAll LeaveAll flag. This field is displayed only when the flag is true. Examples # Enable MVRP state debugging for VLAN 2 on Ethernet 1/1. debugging mvrp state interface ethernet 1/1 vlan 2 *Mar 31 17:52:58:875 2011 Sysname MVRP/7/MVRP_DEBUG: FSM: Ethernet1/1: AtrID = 2: APP = VO Reg = IN, Event = rJoinMt!. // The application state machine was VO, the registration state machine was IN, and the event was rJoinMt!.
NAT debugging commands The output description tables in this document only contain fields and messages that require an explanation. debugging nat Use debugging nat to enable NAT debugging. Use undo debugging nat to disable NAT debugging. Syntax debugging nat { alg | event | packet } [ interface interface-type interface-number ] undo debugging nat { alg | event | packet } [ interface interface-type interface-number ] Default NAT debugging is disabled.
Field Description The IP address in the type A DNS reply has been translated. DNS A answer is translated successfully by dns-map(address1 -> address2). • address1—The IP address before translation. • address2—The IP address after translation. Table 2 describes output fields and messages for the debugging nat event command. Table 86 Output from the debugging nat event command Field Description The packet can't translate by static. Static address translation failed.
Field Description Before address translation: • • • • ( global-source-ip: port1 global-destination-ip: port2) ------> global-source-ip—Source IP address. port1—Source port number. global-destination-ip—Public destination IP address. port2—Destination port number. After address translation: • • • • ( global-source-ip: port1 inside-destination-ip: port2) global-source-ip—Source IP address. port1—Source port number. inside-destination-ip—Destination IP address. port2—Destination port number.
debugging userlog nat Use debugging userlog nat to enable NAT logging debugging. Use undo debugging userlog nat to disabled NAT logging debugging. Syntax debugging userlog nat undo debugging userlog nat Default NAT logging debugging is disabled. Views User view Default command level 1: Monitor level Usage guidelines NOTE: Support for this command depends on the device model. Table 4 describes output fields and messages for the debugging userlog nat command.
// NAT logs were output in UDP packets from slot 3 to the log server. One UDP packet carried two NAT logs. *Dec 6 15:36:39:54 2010 Sysname S8505 USERLOG/8/NAT:Slot=3; Forced to output NAT logs. // The system was forced to output NAT logs because the NAT log buffer was full.
NAT-PT debugging commands debugging natpt Use debugging natpt to enable NAT-PT debugging. Use undo debugging natpt to disable NAT-PT debugging. Syntax debugging natpt { alg | all | event | packet } [ interface interface-type interface-number ] undo debugging natpt { alg | all | event | packet } [ interface interface-type interface-number ] Default NAT-PT debugging is disabled. Views User view Default command level 1: Monitor level Parameters alg: Specifies the application layer gateway (ALG) debugging.
# Enable NAT-PT packet debugging on the NAT-PT device. When the IPv6 host uses FTP to access the IPv4 host, output similar to the following example is generated: debugging natpt packet *0.1150141 Sysname NATPT/7/debug: Pro : TCP TTL : 127 V6 Pkt Translated to V4 Pkt (1000::0001 : (5.1.1.1 : 1041 - 1001::0303:0301 : 1041 - 3.3.3.1 : 21) 21) // NAT-PT translated the source and destination IPv6 addresses in the received IPv6 TCP packet into IPv4 addresses. *0.
TTL : 127 IPv6 packet is translated to IPv4 packet. (1000::0001 : (5.1.1.1 : 1041 - 1001::0303:0301 : 1041 - 3.3.3.1 : 21) 21) // NAT-PT translated the source and destination IPv6 addresses in the received IPv6 TCP packet into IPv4 addresses. *Mar 10 14:28:16:62 2008 Sysname DPNATPT/7/PACKET: Pro : TCP TTL : 254 IPv4 packet is translated to IPv6 packet. (3.3.3.1 : 21 - 5.1.1.
ND attack defense debugging commands The output description tables in this document only contain fields and messages that require an explanation. debugging ipv6 nd detection packet Use debugging ipv6 nd detection packet to enable ND packet debugging for ND detection. Use undo debugging ipv6 nd detection packet to disable ND packet debugging for ND detection. Syntax debugging ipv6 nd detection packet undo debugging ipv6 nd detection packet Default ND packet debugging of ND detection is disabled.
Field Description Dropped ND Packet for no entry match The ND packet was dropped because the ND detection function failed to find any address binding entry matching the packet during source verification. Examples # Enable ND packet debugging for ND detection.
NetStream debugging commands The output description tables in this document only contain fields and messages that require an explanation. debugging ip netstream event Use debugging ip netstream event to enable NetStream event debugging. Use undo debugging ip netstream event to disable NetStream event debugging. Syntax debugging ip netstream event undo debugging ip netstream event Default NetStream event debugging is disabled.
Field Description IP Stream Age 1 streams (cache full) An IP stream entry aged out due to entry overflow. IP Stream Age all streams (cache modify) All IP stream entries aged out due to cache modification. IP Stream Age all streams (reset) All IP stream entries aged out due to resetting. IP Stream Export a stream NetStream exported an IP stream entry. IP Stream Export 0 packets for timeout (no host or no template) No IP packets were exported because of timeout.
Field Description NetStream failed to send a packet. Fail to send (Now queue length is 0) Packet Type: Normal IP Version No: 9 Records: 1 • • • • Packet export queue is 0. Packet type is single IP stream. Packet format is v9. Number of IP stream entries is 1. Active Template (Now 1 active templates):protocol-port inbound Id 271 A template was activated (a total of one activated template). The template type is protocol-port inbound and template ID is 271.
Field Description AS aggregation fields: CPU 0 AS Aggre Add a stream (Now 1 active streams): InIf: 0 OutIf: 1048576 SrcAS: 0 DstAS: 0 Direct: O Aggre Type: AS IP version : 4 First: 551894110 Last: 551894110 Streams: 1 Pkts: 0 1 Bytes: 0 84 Sample Mode: FULL Sample Interval: 0 • • • • • • • • InIf—Inbound interface number. OutIf—Outbound interface number. SrcAS—Source AS number. DstAS—Destination AS number. Aggre Type—Aggregation type. First—First active time of a stream.
Nexthop: 127.0.0.1 BGP Nexthop: 0.0.0.0 Lable 1:0-0-0 2:0-0-0 3:0-0-0 TopLabel Type: UNKNOWN IP: 0.0.0.0 Mask: 0.0.0.0 SrcMAC: 0000-0000-0000 DstMAC: 0000-0000-0000 SrcVlan: 0 DstVlan: 0 First: 10981810 Last: 10981810 Pkts: 0 1 Bytes: 0 60 Sample Mode: 0 Sample Interval: 0 // An IPv4 stream was added to the list. # Enable IPv4 NetStream event debugging. Output in the following example is generated when NetStream entry aged out after 10 seconds because the NetStream inactive aging timer timed out.
Packet Type: Normal IP Version No: 9 Records: 1 // A packet was successfully sent. *Mar 21 12:31:56:890 2008 H3C NS/7/NS_EVENT: CPU 0 IP Stream Export 1 packets for timeout // An IP stream entry packet was sent. *Mar 21 12:31:56:890 2008 H3C NS/7/NS_EVENT: Select Template for aggre(Version 9 Type as inbound Id 257 ) // A template was selected for an AS aggregation stream entry.
Default command level 1: Monitor level Usage guidelines Table 2 describes the output fields and messages for the debugging ip netstream packet command. Table 91 Output from the debugging ip netstream packet command Field Description Send succeed! NetStream sent a packet successfully. Send fail! NetStream failed to send a packet. Packet Type: Normal IP Version No: 5 Records: 2 SrcIP(Port): 192.168.20.173(40000) DstIP(Port): 192.168.20.180(138) VrfID: 0 • • • • Packet Type—Exported packet type.
NQA debugging commands The output description tables in this document only contain fields and messages that require an explanation. debugging nqa Use debugging nqa to enable NQA debugging. Use undo debugging nqa to disable NQA debugging. Syntax debugging nqa { all | error | event | reaction } undo debugging nqa { all | error | event | reaction } Default NQA debugging is disabled. Views User view Default command level 1: Monitor level Parameters all: Enables all types of debugging for NQA.
Table 93 Output from the debugging nqa reaction command • Field • Description • Owner: owner • Name of the administrator who creates the NQA operation. • Tag: tag • NQA operation tag. • Previous status: status • Previous status: • 1—The previous status is invalid. • 2—The number of consecutive probe failures exceeds the threshold. • 3—The operation succeeded. • Current status: status • Current status: • 1—The current status is invalid.
*Apr 29 21:47:25:706 2007 Sysname NQA/7/NQA_Event: ICMP test (admin-test): Probe succeeded. // The operation succeeded. # Cancel the NQA operation schedule. [Sysname] undo nqa schedule admin test *Apr 29 21:49:00:206 2007 Sysname NQA/7/NQA_Event: NQA Schedule: The schedule of entry(admin-test) is cancelled. // The NQA operation schedule was successfully cancelled.
NTP debugging commands The output description tables in this document only contain fields and messages that require an explanation. debugging ntp-service Use debugging ntp-service to enable NTP debugging. Use undo debugging ntp-service to disable NTP debugging.
Table 94 Output from the debugging ntp-service adjustment command Field Description NTP: gradual systime NTP is gradually adjusting the system time. NTP: step systime NTP is adjusting the system time in one step. adj: string Time that is adjusted in the current time adjustment operation. residual: string Remaining value for the most recent time adjustment. offset: string Offset for step adjustment. Table 2 describes output fields and messages for the debugging ntp-service authentication command.
Field Description new drift_comp: string New frequency. Table 5 describes output fields and messages for the debugging ntp-service packet command. Table 98 Output from the debugging ntp-service packet command Field Description NTP: titleAndTip control packet from sourceIPAddress to DestIPAddress • titleAndTip—Title and prompt information. • sourceIPAddress—Source IP address of the packet. • DestIPAddress—Destination IP address of the packet. version: string Version number in the control packet.
Field Description xmttime: string Transmit timestamp. inptime: string Timestamp for processing a packet. packet from SourceIPAddress to DestIPAddress on InterfaceName • SourceIPAddress—Source IP address. • DestIPAddress—Destination IP address. • InterfaceName—Name of the interface receiving the packet. Table 6 describes output fields and messages for the debugging ntp-service parameter command.
Table 8 describes output fields and messages for the debugging ntp-service selection command. Table 101 Output from the debugging ntp-service selection command Field Description nlist: string Number of the candidate clocks in candidate clock list. allow: string Number of surviving candidates. found: string Number of discarded candidates. low: string Lower value of the sample offset. high: string Upper value of the sample offset. candidate: string IP address of a candidate clock.
Examples # Enable NTP packet debugging on Device A. The output in this example was created when the following conditions exist: • On Device A and Device B, the IP addresses for VLAN-interface 1 are 10.1.1.1 and 10.1.1.2, respectively. • The IP addresses can be pinged from each other. • Device B's local clock is to be used as a reference source, with the stratum level of 8. • Device A is configured to synchronize its clock to Device B in client/server mode.
OAA debugging command debugging oaa remote-interface Use debugging oaa remote-interface to enable debugging for the OAA remote interface management module. Use undo debugging oaa remote-interface to disable debugging for the OAA remote interface management module. Syntax debugging oaa remote-interface { all | error | event } undo debugging oaa remote-interface { all | error | event } Default Debugging is disabled for the OAA remote interface management module.
OSPF debugging commands The output description tables in this document only contain fields and messages that require an explanation. debugging ospf event Use debugging ospf event to enable OSPF event debugging. Use undo debugging ospf event to disable OSPF event debugging.
Field Description Detailed OSPF BFD message information: • msg-type—BFD message type, which can be OSPF-BFD: Message type msg-type, Connect type conn-type, Src IP Address src-ip, Src IFIndex if-index, Dst IP Address dst-ip delete session, rcv BFD down, create session, or disable BFD. • conn-type—Connection type, which is direct-connect. • Source IP address, source interface, and destination IP address. Table 2 describes output fields and messages for the debugging ospf event neighbor command.
• On Router A, OSPF process 1 is created and area 0 is created in OSPF process 1. Ethernet 1/0 is enabled with OSPF and is configured to belong to area 0. • On Router B, OSPF process 1 is created. Ethernet 1/0 is enabled with OSPF and is configured to belong to area 0. debugging ospf event neighbor OSPF 1: Nbr 150.1.1.2 Rcv KillNbr State Full -> Down. OSPF 1: Nbr 150.1.1.2 Rcv HelloReceived State Down -> Init. OSPF 1: Nbr 150.1.1.2 Rcv 2WayReceived State Init -> 2Way.
OSPF 1 restarted OOB Progress timer for neighbor 150.1.1.2. OSPF 1 deleted OOB Progress timer for neighbor 150.1.1.2. OSPF 1 Gr Wait Timeout timer fired. OSPF 1 deleted GR wait timer. OSPF 1 deleted GR Interval timer. OSPF 1 GR Completed for OSPF Router // The device completed the GR. OSPF 1 notified RM that OSPF process left GR. RM notified that all protocol left GR. OSPF 1 started flushing STALE LSA after all protocol left GR. // OSPF started to flush stale LSAs after all the protocol exited GR.
Field Description OSPF HSB Bkp: Instance ID: instance-id Process ID: process-id Area ID: area-id OSPF HSB Res: Instance ID: instance-id Process ID: process-id OSPF HSB Res: Instance ID: instance-id Process ID: process-id Area ID: area-id OSPF backed up the OSPF process area data under the specified instance. • instance-id—OSPF instance ID. • process-id—OSPF process ID. • area-id—Area ID. OSPF restored the OSPF process data under the specified instance. • instance-id—OSPF instance ID.
OSPF HSB Bkp: Process ID: 1 Index:4 Area ID: 0.0.0.1 IpAdderss :11.11.11.11 Physical Logical Index:0.0.0.0 // OSPF backed up the data on Loopback 1 in area 1 of process 1. *Apr 26 10:45:44:428 2007 RouterA RM/6/RMDEBUG: OSPF HSB Bkp: Process ID: 1 Index:3 Area ID: 0.0.0.0 IpAdderss :10.10.10.10 Physical Logical Index:0.0.0.0 // OSPF backed up the data on Loopback 0 in area 0 of process 1. %Apr 26 10:45:55:483 2007 RouterA HA/4/LOG: Batch backup finished // Batch backup finished.
Field Description LSA header information: • ls-type—LSA type: LSAType: ls-type LinkStateId: link-state-id Advertising Rtr: rt-id 1 for Router LSA. 2 for network LSA. 3 for net-summary LSA. 4 for ASBR-summary LSA. 5 for AS-external–LSA. 7 for NSSA LSA. 9, 10, and 11 for Opaque LSA. • link-state-id—LSA ID. • rt-id—ID of the advertising router. LSA header information: LSA Age: age Options : ExRouting: ON/OFF • age—LSA age.
Examples # Enable debugging for the installation of LSAs into the LSDB on Router A. The output in this example was created when the following conditions exist: • Ethernet 1/0 (150.1.1.1/24) on Router A is connected to Ethernet 1/0 (150.1.1.2/24) on Router B over a broadcast network. • On Router A,OSPF process 1 is created and area 0 is created in OSPF process 1. Ethernet 1/0 is enabled with OSPF and is configured to belong to area 0. • On Router B, OSPF process 1 is created.
*Sep 8 17:51:07:238 2006 RouterA RM/6/RMDEBUG:LinkStateId: 201.1.1.1. *Sep 8 17:51:07:248 2006 RouterA RM/6/RMDEBUG:Advertising Rtr: 201.1.1.1. *Sep 8 17:51:07:248 2006 RouterA RM/6/RMDEBUG:LSA Age: 0 Options: ExRouting:ON. *Sep 8 17:51:07:248 2006 RouterA RM/6/RMDEBUG:Length: 36 Seq# 80000009 CheckSum: 34281. *Sep 8 17:51:07:258 2006 RouterA RM/6/RMDEBUG:Capabilities: VBit:0 EBit: 512 BBit: 0 NtBit: 0 Link# 1. *Sep 8 17:51:07:258 2006 RouterA RM/6/RMDEBUG:LinkID: 150.1.1.1 LinkData: 150.1.1.
*Dec 12 11:07:33:610 2006 RouterA RM/6/RMDEBUG:LSA Age: 0 Options: ExRouting:ON. *Dec 12 11:07:33:610 2006 RouterA RM/6/RMDEBUG:Length: 36 Seq# 8000002c CheckSum: 3185. *Dec 12 11:07:33:610 2006 RouterA RM/6/RMDEBUG:Capabilities: VBit:0 EBit: 0 BBit: 0 NtBit: 0 Link# 1. *Dec 12 11:07:33:610 2006 RouterA RM/6/RMDEBUG:LinkID: 150.1.1.0 LinkData: 255.255.255.0 LinkType: 3. *Dec 12 11:07:33:610 2006 RouterA RM/6/RMDEBUG:TOS# 0 Metric 10. // The device generated router LSAs.
Examples # Enable MPLS-TE debugging for OSPF on Router A. The output in this example was created when the following conditions exist: • • • Router A is configured with MPLS TE, OSPF, and LDP. Loopback 0 is created on Router A, with an IP address of 1.1.1.1/32. Ethernet 1/0 (150.1.1.1/24) on Router A is connected to Ethernet 1/0 (150.1.1.2/24) on Router B over a broadcast network. On Router A: OSPF process 1 is created and is enabled with Opaque.
Area ID : 0.0.0.0 Attached Rtr Count : 2 MPLS DR Router ID : 2.2.2.2 DR Intf Addr : 150.1.1.2 Received Network LSA by OSPF TE Process ID : 1 Area ID : 0.0.0.0 Link Id : 150.1.1.2 Attached Rtr Count : 2 Advtg Router ID : 2.2.2.2 *Dec 20 15:01:37:98 2006 RouterA RM/6/RMDEBUG:OSPF TE Send Network LSA to CSPF SUCCESS Process ID : 1 Area ID : 0.0.0.0 Attached Rtr Count : 2 MPLS DR Router ID : 2.2.2.2 DR Intf Addr : 150.1.1.
Area ID : 0.0.0.0 Attached Rtr Count : 2 MPLS DR Router ID : 2.2.2.2 DR Intf Addr : 150.1.1.2 *Dec 20 15:01:37:130 2006 RouterA RM/6/RMDEBUG:OSPF TE ReceiveOpqLsa: Processed Success *Dec 20 15:01:40:194 2006 RouterA RM/6/RMDEBUG:OSPF TE Received Network LSA by OSPF TE Process ID : 1 Area ID : 0.0.0.0 Link Id : 3.1.1.2 Attached Rtr Count : 2 Advtg Router ID : 3.3.3.3 *Dec 20 15:01:50:194 2006 RouterA RM/6/RMDEBUG:OSPF TE Received Network LSA by OSPF TE Process ID : 1 Area ID : 0.0.0.
Table 107 Output from the debugging ospf non-stop-routing command Field Description Smooth start Active/standby switchover started. Smooth start on the interface Active/standby switchover started on the interface.
debugging ospf non-stop-routing system-view [RouterA] ospf non-stop-routing *Apr 19 10:39:17:641 2010 RouterA RM/6/RMDEBUG: NSR: NSR configuration backed up // NSR backed up configuration data.
*Apr 19 11:03:29:719 2010 RouterA RM/6/RMDEBUG: NSR: 0x3030303(7) of interface 6 in area 1 of process 1 Back up in real time neighbor *Apr 19 11:03:29:719 2010 RouterA RM/6/RMDEBUG: NSR: Back up LSAs in real time type: 0x2, advertising router: 0x3030303, link ID: 0x4010121, age: 0x1, sequence number:0x80000001, recvif:6,recvNbr:0x4010121 // NSR is backing up LSAs in real time.
Table 6 describes output fields and messages for the debugging ospf packet command. Table 108 Output from the debugging ospf packet command Field Description OSPF process-id OSPF process ID. SEND Packet OSPF sent packets. RECV Packet OSPF received packets. Source Address: src-addr Source IP address of the OSPF packet. Destination Address: dst-addr Destination IP address of the OSPF packet. OSPF packet header information: • ver—OSPF version2.
Field Description OSPF hello packet information: Rtr Priority: rt-pri, Dead Int: dead-interval, DR: ip-addr, BDR: ip-addr • rt-pri—Router priority. • dead-interval—Neighbor dead interval , in seconds. • ip-addr—IP address of the DR or BDR on the interface network segment. OSPF hello packet information. Attached Neighbor: rt-id rt-id indicates the router ID of the neighbor discovered by OSPF. OSPF hello packet information.
Field Description OSPF DD packet information. DD SeqNumber: seq-num seq-num indicates the DD packet sequence number. OSPF DD, LSR, and LSAck packet information. Contents of the LSAs described in the OSPF packets: • ls-type—LSA type: LSAType: ls-type, LinkStateId: ls-id, Advertising Rtr: rt-id 1 for Router LSA. 2 for network LSA. 3 for net-summary LSA. 4 for ASBR-summary LSA. 5 for AS-external–LSA. 7 for NSSA LSA. 9, 10, and 11 for Opaque LSA. • ls-id—LSA link ID.
*0.68908828 RouterA RM/6/RMDEBUG:Rtr Priority: 1, Dead Int: 40, DR: 150.1.1.1, BDR: 0.0.0.0. // OSPF process 1 sent a hello packet. It has not found any neighbors. *0.68913955 RouterA RM/6/RMDEBUG:OSPF 1: RECV Packet. *0.68913955 RouterA RM/6/RMDEBUG:Source Address: 150.1.1.2 *0.68913965 RouterA RM/6/RMDEBUG:Destination Address: 224.0.0.5 *0.68913965 RouterA RM/6/RMDEBUG:Ver# 2, Type: 1, Length: 44. *0.68913965 RouterA RM/6/RMDEBUG:Router: 202.1.1.1, Area: 0.0.0.0, Chksum: 12700. *0.
*0.68934274 RouterA RM/6/RMDEBUG:OSPF 1: RECV Packet. *0.68934274 RouterA RM/6/RMDEBUG:Source Address: 150.1.1.2 *0.68934274 RouterA RM/6/RMDEBUG:Destination Address: 224.0.0.5 *0.68934284 RouterA RM/6/RMDEBUG:Ver# 2, Type: 1, Length: 48. *0.68934284 RouterA RM/6/RMDEBUG:Router: 202.1.1.1, Area: 0.0.0.0, Chksum: 14735. *0.68934284 RouterA RM/6/RMDEBUG:AuType: 00, Key(ascii): 0 0 0 0 0 0 0 0. *0.68934284 RouterA RM/6/RMDEBUG:Net Mask: 255.255.255.0, Hello Int: 10, Option: _E_. *0.
Table 7 describes output fields and messages for the debugging ospf spf brief command. Table 109 Output from the debugging ospf spf brief command Field Description OSPF process-id OSPF process ID. SPF schedule event. schedule-event: SPF schedule event. It can be 0x80000000, 0x40000000, 0x10000000, 0x00008000, 0x00004000, 0x00000020, or 0x00000010. Schedule Event: schedule-event at X ms SPF schedule flag indicating SPF is scheduled. schedule-flag: Schedule flag.
Field Description FRR Intra-Area RtrRoute BkNextHop Calc End In FRR auto-mode, the calculation for the backup next hop of intra-area routes of the router type ended. FRR Inter-Area RtrRoute BkNextHop Calc Begin In FRR auto-mode, the calculation for the backup next hop of inter-area routes of the router type began. FRR Inter-Area RtrRoute BkNextHop Calc End In FRR auto-mode, the calculation for the backup next hop of inter-area routes of the router type ended.
Field Description Add root to area area-id Candidate List OSPF added the root node to the candidate list of SPF calculation in area area-id. Information of the router LSA associated with candidate nodes: • link-id—Link ID of the router LSA. • rt-id—ID of the advertising router. • link-count—Number of links in the router LSA.
Field Description Operation on the current candidate node (router node). • op-type—Type of operation to perform on the op-type vertex:Rtr-Lsa link-id, Cost to root cost, Nh next-hop candidate node. It can be Add, Update, Remove, or Get. • link-id—Link ID of the router LSA. • cost—Cost to the root node. • next-hop—Next hop. Operation on the current candidate node (network node).
Field Description Add nexthop next-hop to candidate nexthop list In FRR auto-mode, a next hop is added to the candidate next hop list. In FRR auto-mode, the candidate next hop is processed. • next-hop—Candidate next hop address. • nbr-id—Router ID of the neighbor corresponding Candidate nexthop next-hop, Nbr nbr-id to the candidate next hop. In FRR auto-mode, the candidate next hop is processed. • next-hop—Candidate next hop address.
Field Description In FRR auto-mode, the candidate next hop is selected because it is more optimal than the old backup next hop. The reasons why the candidate next hop is selected as the route backup next hop include the following: Candidate nexthop reason, update backup nexthop • • • • • • • Is loop-free. Is primary. Is node-protect. Is link-protect. Is downstream. Is closer to destination. Has smaller IP address.
Field Description In FRR auto-mode, the result of calculating the backup next hop for intra-area routes of the network type is listed. • net-route-type—Network type, which can be Transit or Stub. • • • • • net-rotue-type route, dest-id /mask-len, nh next-hop,bnh backup-next-hop ,attr-list dest-id—Destination IP address. mask-len—Mask length. next-hop—Next hop address. backup-next-hop—Backup next hop address. attr-list—List to which the route belongs.
Field Description FULL SPF ASE Begin at bucket bucket-num Full ASE SPF calculation began at bucket bucket-num in the Hash table. FULL SPF ASE Stop at bucket bucket-num Full ASE SPF calculation stopped at bucket bucket-num in the Hash table. INCR SPF ASE Begin Incremental ASE SPF began. INCR SPF ASE End Incremental ASE SPF ended. LSA ID inconsistent with netmas. LSID: ls-id, Netmask: net-mask ASE LSA ID and network mask are inconsistent.
When you restart OSPF process 1, output similar to the following example is generated: debugging ospf spf brief reset ospf 1 process Warning : Reset OSPF process? [Y/N]: OSPF 1 Schedule Event: 0x80000000 at 1200641 ms. // Event triggering the SPF schedule. OSPF 1 SPF Intra Area Full Schedule // Full SPF calculation schedule. OSPF 1 Schedule Flag : 0x80000000 SPF is scheduled. // SPF schedule flag. OSPF 1 Schedule Event: 0x80000000 at 1200641 ms.
// OSPF is deleting unreachable routes. OSPF 1 SPF deletes Inter AS unreachable routes end // OSPF finished deleting inter-AS unreachable routes. OSPF 1 **** FRR SPF Calc On Nbr Begin **** // SPF route computation began. The root is the neighboring node. OSPF 1 **** Process (Intra) Area 0.0.0.0. **** // OSPF is processing SPF route computation in area 0. The root is the neighboring node. OSPF 1 **** FRR SPF Calc On Nbr End **** // SPF route computation ended. The root is the neighboring node.
OSPF 1 Add root to area 0.0.0.0 Candidate List. // OSPF added the root node to the candidate list of SPF calculation in area area-id. OSPF 1 Get vertex:Rtr-Lsa 1.1.1.1, Cost to root 0,Nh OSPF 1 Rtr-LSA 1.1.1.1,adv 1.1.1.1,link count 1 OSPF 1 OSPF 1 TransNet Link 150.1.1.2,Data 150.1.1.1,Cost 10 Add vertex:Net-Lsa 150.1.1.2/24,Cost to root 10,Nh 150.1.1.1 // OSPF added a candidate node. OSPF 1 Get vertex:Net-Lsa 150.1.1.2/24,Cost to root 10,Nh 150.1.1.1 OSPF 1 OSPF 1 Find old route for 150.1.1.
OSPF 1 OSPF 1 TransNet Link 150.1.1.2,Data 150.1.1.2,Cost 1 Add vertex:Net-Lsa 150.1.1.2/24,Cost to root 1,Nh OSPF 1 Get vertex:Net-Lsa 150.1.1.2/24,Cost to root 1,Nh OSPF 1 Add transit route 150.1.1.0/24,Nh 0.0.0.0,cost 1 OSPF 1 Net-LSA 150.1.1.2,adv 2.2.2.2,router count 2 OSPF 1 OSPF 1 OSPF 1 OSPF 1 Attach Router 1.1.1.1 Add vertex:Rtr-Lsa 1.1.1.1, Cost to root 1,Nh Attach Router 2.2.2.2 Drop neighbor Rtr-Lsa 2.2.2.2 for in spf tree OSPF 1 Get vertex:Rtr-Lsa 1.1.1.
OSPF 1 NetSum-LSA 4.4.4.0/24 Adv 2.2.2.2 cost 10 OSPF 1 Don't calculate for route falling into active ABR range OSPF 1 Router Type Dest:3.3.3.3 OSPF 1 Router Type Dest:2.2.2.2 OSPF 1 Delete Route Dest:4.4.4.0/24 Id:42 from RM OSPF 1 Nexthop: 150.1.1.2 (Ethernet1/0) OSPF 1 Delete OSPF inter-area Route:4.4.4.0/24 ID:42 OSPF 1 Delete Route Dest:11.11.11.0/24 Id:43 from RM OSPF 1 OSPF 1 Nexthop: 150.1.1.2 (Ethernet1/0) Delete OSPF type2 Route:11.11.11.
OSPF 1 Add vertex:Rtr-Lsa 2.2.2.2, Cost to root 10,Nh 150.1.1.2 OSPF 1 Get vertex:Rtr-Lsa 2.2.2.2, Cost to root 10,Nh 150.1.1.2 OSPF 1 Can't find Rtr route001 RM/6/RMDEBUG: OSPF 1 Add ABR/ASBR route,cost 10,Nh 150.1.1.2 OSPF 1 Rtr-LSA 2.2.2.2,adv 2.2.2.2,link count 1 OSPF 1 OSPF 1 TransNet Link 150.1.1.2,Data 150.1.1.2,Cost 10 Drop neighbor Net-Lsa 150.1.1.2/24 for in spf tree OSPF 1 Calculate the leaf network. OSPF 1 Candidate list empty,SPF Area 0.0.0.0 finish. OSPF 1 SPF area 0.0.0.
• OSPF process 1 is created on Router A. Area 0 is created in OSPF process 1. OSPF is enabled on Ethernet 1/0, which is configured to belong to area 0. • OSPF process 1 is created on Router C. Area 1 is created in OSPF process 1. OSPF is enabled on Ethernet 1/0, which is configured to belong to area 1. Static routes are configured and redistributed into OSPF process 1. • On Router A, enable FRR to automatically calculate the backup next hop.
OSPF 1 ASE net route,100.1.5.0/24,nh 150.1.1.2 OSPF 1 ASE net route,100.1.5.0/24,Inherit backup nexthop OSPF 1 ASE net route,100.1.5.0/24,nh 150.1.1.2,bnh 0.0.0.0 OSPF 1 ASE net route,100.1.6.0/24,nh 150.1.1.2 OSPF 1 ASE net route,100.1.6.0/24,Inherit backup nexthop OSPF 1 ASE net route,100.1.6.0/24,nh 150.1.1.2,bnh 0.0.0.0 OSPF 1 ASE net route,100.1.7.0/24,nh 150.1.1.2 OSPF 1 ASE net route,100.1.7.0/24,Inherit backup nexthop OSPF 1 ASE net route,100.1.7.0/24,nh 150.1.1.2,bnh 0.0.0.
When you restart OSPF process 1, output similar to the following example is generated: debugging ospf timer reset ospf 1 process Warning : Reset OSPF process? [Y/N]:y %Sep 18 11:21:04:612 2006 RouterA RM/3/RMLOG:OSPF-NBRCHANGE: Process 1, Neighbour 150.1.1.2(Ethernet1/0) from Full to Down OSPF 1 reset SPF TIMER,timeout value is 5000 ms // OSPF reset the SPF calculation timer with a timeout value of 5000 milliseconds.
OSPFv3 debugging commands The output description tables in this document only contain fields and messages that require an explanation. debugging ospfv3 event Use debugging ospfv3 event to enable OSPFv3 event debugging, such as ABR, ASBR, or virtual link event debugging. Use undo debugging ospfv3 event to disable OSPFv3 event debugging. Syntax debugging ospfv3 event { abr | all | bfd | asbr | vlink } undo debugging ospfv3 event { abr | all | asbr | bfd | vlink } Default OSPFv3 event debugging is disabled.
Table 113 Output from the debugging ospfv3 event bfd command Field Description Message Type XXXX Type of message that OSPF uses to notify information to BFD, including create session and delete session. Connect Type direct-connect The connection type of the BFD session is direct connection. Src IP Address X::X Source IPv6 address. Dst IP Address X::X Destination IPv6 address. Examples # Enable ASBR event debugging on Router A.
Table 114 Output from the debugging ospfv3 graceful-restart command Field Description received smooth message OSPFv3 received a GR message. Notify RM enter GR OSPFv3 notified the route management module that the device enters the GR process. Grace-LSA sending timer expired on interface IFNAME Grace-LSA sending timer expired on interface IFNAME specified by the interface type and interface number.
When you perform a master/backup switchover on Router A, output similar to the following example is generated: debugging ospfv3 graceful-restart %Jun 12 11:10:13:969 2008 RouterA RM/3/RMLOG:OSPFv3 Process 1 Neighbor 8.8.8.8(Ethernet1/1) from Full to Down *Jun 12 11:10:13:969 2008 RouterA RM/6/RMDEBUG:OSPFv3 received smooth message. *Jun 12 11:10:13:969 2008 RouterA RM/6/RMDEBUG:OSPFv3 1 GR: Notify RM enter GR. *Jun 12 11:10:14:00 2008 RouterA RM/6/RMDEBUG:OSPFv3 1 GR: Enter GR.
*Jun 12 11:10:25:391 2008 RouterA RM/6/RMDEBUG:OSPFv3 1 GR: Flush all self stale router-LSAs and network-LSAs. // OSPFv3 is deleting stale LSAs. *Jun 12 11:10:25:391 2008 RouterA RM/6/RMDEBUG:OSPFv3 1 GR: Schedule whole route calculation. // A route calculation was triggered. *Jun 12 11:10:29:484 2008 RouterA RM/6/RMDEBUG:OSPFv3 1 GR: Whole route calculation finished.
Views User view Default command level 1: Monitor level Parameters event: Specifies event debugging for the interface state machine. status: Specifies status debugging for the interface state machine. timer: Specifies timer debugging for the interface state machine. Usage guidelines Table 4 describes output fields and messages for the debugging ospfv3 ifsm command.
Field Description ifsm_ignore called The received event is not processed. Interface state: • Down—The interface is down. • Loopback—The interface is a loopback interface. Status change state1 -> state2 • Waiting—The interface is in the waiting state. • P-To-P—The interface is connected to a P2P network or configured as one end of a virtual link. • Backup—The interface is the backup designated router. • DR—The interface is the designated router. string timer expire Timer expired.
Views User view Default command level 1: Monitor level Parameters all: Specifies all LSA debugging. flooding: Specifies LSA flooding debugging. generate: Specifies LSA generation debugging. install: Specifies debugging of LSAs installation into the LSDB. maxage: Specifies LSA maxage debugging. refresh: Specifies LSA refresh debugging. verbose: Specifies LSA detailed debugging information. Usage guidelines Table 5 describes output fields and messages for the debugging ospfv3 lsa flooding command.
Table 117 Output from the debugging ospfv3 lsa maxage command Field Description Flag bit: • V—Vlink end. Flags;string • E—ASBR. • B—ABR. • W—MOSPF support. Router processing capabilities: • V6—A value of 0 indicates that the router/link will not take part in IPv6 route calculation. • E—A value of 0 indicates that the flooding of AS-External-LSAs is not supported. Options • MC—Multicast-related. • N—Indicates whether it is in a Not So Stub Area (NSSA). • R—Indicates whether this is an Active Router.
When a neighbor relationship is established between Router A and Router B, output similar to the following example is generated: debugging ospfv3 lsa flooding *0.14227421 Sysname RM/6/RMDEBUG: OSPFv3 LSA[Link(Ethernet1/0):Type(0x0008) :0.15.0.24:34.1.1.1 *]: consider flooding through interface[Ethernet1/0] // OSPFv3 advertised an LSA (the LSA type is 0x0008, Link State ID is 0.15.0.24, and advertising router ID is 34.1.1.1) through Ethernet 1/0. *0.
Table 118 Output from the debugging ospfv3 nfsm command Field Description NFSM[RouterID -ifid] Router ID and interface ID of the neighbor router. Neighbor status changed from state1 to state2. The values of state1 and state2 can be: • Down—The neighbor is down. • Attempt—A further attempt is made to contact the neighbor after not receiving anything from it. • Init—A hello packet sent by the neighbor is received but 2-way communication is not Status change state1->state2 established.
Field Description Neighbor state state and triggering event event. Current neighbor state: • Down—The neighbor is down. • Attempt—A further attempt is made to contact the neighbor after receiving nothing from it. • Init—The hello packets sent by the neighbor were received but 2-way communication is not established with the neighbor. • 2-Way—2-way communication is established. • ExStart—The master/subordinate negotiation is performed. • Exchange—DD packets are exchanged.
Examples # Enable neighbor state machine debugging on Router A. The output in this example was created when the following conditions exist: • Router A is connected to Router B through Ethernet 1/0. • OSPFv3 process 1 is created on Router A. OSPFv3 is enabled on Ethernet 1/0. • OSPFv3 process 1 is created on Router B. OSPFv3 is enabled on Ethernet 1/0. debugging ospfv3 nfsm *0.5752906 Sysname RM/6/RMDEBUG:OSPFv3 NFSM[34.1.1.
Usage guidelines Table 8 describes output fields and messages for the debugging ospfv3 packet command. Table 119 Output from the debugging ospfv3 packet command Field Description OSPFv3 sent/received hello packets. • event—RECV indicates that a hello packet is Packet[event] : src(source-ipv6) -> dst(dest-ipv6) received. SEND indicates that a hello packet is sent. • source-ipv6—Source IPv6 link-local address of the hello packet. • dest-ipv6—Destination IPv6 link-local address of the hello packet.
Field Description OSPFv3 discarded the received DD packet. state indicates the current neighbor state. It can be: • Down—The neighbor is down. RECV[DD]:Neighbor state is state, packet discarded • Attempt—A further attempt is made to contact the neighbor after receiving nothing from it. • Init—The hello packet sent by the neighbor is received but 2-way communication is not established. The neighbor state is less than Exchange and the packet is discarded. state indicates the neighbor state.
Syntax debugging ospfv3 route [ ase | ia | install | spf ] undo debugging ospfv3 route [ ase | ia | install | spf ] Default OSPFv3 route debugging is disabled. Views User view Default command level 1: Monitor level Parameters ase: Specifies OSPFv3 ASE route debugging. ia: Specifies OSPFv3 inter-area route debugging. install: Specifies debugging of OSPFv3 routes installation into the routing table. spf: Specifies OSPFv3 SPF route calculation debugging.
Field Description OSPFv3 installed the vertex to the candidate list. LS_TYPE indicates LSA type. It can be: Install LS_TYPE Vertex Id LSID Adv by AdvRouter candidate list • Router. • Network. LSID indicates link State ID of the LSA. AdvRouter indicates ID of the advertising router. Route[IA:AreaID] Inter-area route calculation. Examples # Enable SPF route debugging on one of the two interconnected devices enabled with OSPFv3.
*0.82475062 Sysname RM/6/RMDEBUG:OSPFv3 SPF[0.0.0.0]: Link[0] to Router 34.1.1.1 // Link 0 pointed to router 34.1.1.1. *0.82475062 Sysname RM/6/RMDEBUG:OSPFv3 SPF[0.0.0.0]: doesn't have link back to (34.1.1.1-0.15.0.24) Link[0] (34.1.1.1-0.0.0.0): // Vertex (34.1.1.1-0.0.0.0) did not have any link back to vertex 34.1.1.1-0.15.0.24. *0.82475078 Sysname RM/6/RMDEBUG:OSPFv3 SPF[0.0.0.0]: LSA[Area(0.0.0.0):Type(0x2001):0.0.0.0:45.2.2.
PIM debugging commands Support for VPN instances depends on your device model. The output description tables in this document only contain fields and messages that require an explanation. debugging pim Use debugging pim to enable PIM debugging. Use undo debugging pim to disable PIM debugging.
msdp: Specifies debugging for packets exchanged between PIM and MSDP. neighbor: Specifies PIM neighbor debugging. basic-acl-number: Specifies a basic ACL number in the range of 2000 to 2999. register: Specifies PIM register message debugging. routing-table: Specifies debugging for state change of the PIM multicast routing table. rp: Specifies debugging for PIM packets related to the BSR and the RP. state-refresh: Specifies PIM state refresh message debugging.
Field Description MC Number of sent Offer or Winner packets. Offer Initial state of DF election. Lose DF election state: Lose. Win DF election state: Win. Backoff The winner DF received better Offer packets. Table 3 describes output fields and messages for the debugging pim event command. Table 123 Output from the debugging pim event command Field Description unsupported pim version The PIM packet version is not supported. PIM packet too short The PIM packet is too short.
Field Description NotJoined The PIM-SM (S, G) or (*, G) upstream state machine was in not-joined state. PruneTmp The PIM-SM (S, G, RPT) downstream state machine was in temporary prune state. PPendingTmp The PIM-SM (S, G, RPT) downstream state machine was in temporary prune pending state. PPT Expired The prune pending timer timed out. RPF_Interface changed The RPF interface changed. Genid changed The neighbor generation ID changed. PT Expired The prune timer timed out.
Field Description Join: addr/mask flag Join: source address/mask flag. Message truncated. Ignoring message The message was dropped due to invalid message length. Unable to decode address Address decoding failed. Upstream neighbor is not this router. Ignoring The message was dropped because the upstream neighbor is not this device. group boundary detected for address1 on address2 Address 1 is within the multicast boundary configured on the interface corresponding to address 2.
Field Description PIM Neighbor address on interface interfacename timed out Neighbor address on interfacename timed out. Failed to create PIM neighbor address, PIM Hello denied by neighbor policy on interfacename A PIM neighbor relationship failed to be established because the source address in the hello message failed to pass the configured hello message filtering. Table 6 describes output fields and messages for the debugging pim register command.
Field Description holdtime Holdtime field in the C-RP advertisement message. Admin Scope Zone Administratively scoped zone. Bad BSR address Incorrect BSR address. frag Fragment tag field in the BSR bootstrap message. pri Priority field in the BSR bootstrap message. hash mask len Hash mask length field in the BSR bootstrap message. Group address/length: frags m, C-RP's n The frags field corresponding to address/length in the BSR bootstrap message is specified by m.
Field Description Lose the ASBSR election The device lost the BSR election in the BSR admin-scope region. Lose the BSR election The device lost the BSR election. locally scoped Node-local or link-local scope. RP changed The RP changed. pending state The BSR changed to the pending state. Update the BSR's state to elected The BSR changed to the elected state. RPF Failure RPF check failed. admin scope multicast address Address in the admin-scope range.
*0.663235 Sysname PIM/7/ASSERT:(public net): PIM ver 2 AST sending 30.1.1.2 -> 224.0.0.13 on Vlan-interface30 (P012343) *0.663235 Sysname PIM/7/ASSERT:(public net): For 229.0.0.1/32 from 100.1.1.11, rpt unset, pref 10, metric 3 (P012351) // PIM sent a PIMv2 assert message from 30.1.1.2 to 224.0.0.13 out of VLAN-interface 30. # Enable DF information debugging on the public network.
// Because the prune pending timer timed out, the downstream state machine of the outgoing interface VLAN-interface 10 of the PIM-SM state entry (*, 229.0.0.1) transited from prune pending to no-information. # Enable debugging for join/prune messages for the public network. debugging pim join-prune receive *0.6209953 Sysname PIM/7/JP:(public net): PIM ver 2 JP receiving 20.1.1.2 -> 224.0.0.13 on Vlan-interface20 (P012176) *0.6209953 Sysname PIM/7/JP:(public net): Upstream 20.1.1.
*0.1526343 Sysname PIM/7/NBR:(public net): Option: 19, length: 4 (P011891) *0.1526343 Sysname PIM/7/NBR:(public net): DR priority: 1 (P011916) *0.1526343 Sysname PIM/7/NBR:(public net): Option: 20, length: 4 (P011891) *0.1526343 Sysname PIM/7/NBR:(public net): Genid: 0X67DC7FAB (P011923) // PIM sent a PIMv2 hello message from 10.1.1.1 to 224.0.0.13 out of VLAN-interface 10. # Enable debugging for inbound PIM register messages for the public network. debugging pim register receive *0.
*0.3307890 Sysname PIM/7/RP:(public net): Receive BSR packet. And use BSR Mechanism now. (S031694) // PIM received a PIMv2 bootstrap message from 10.1.1.1 to 224.0.0.13 on VLAN-interface 10. # Enable debugging for outbound PIM packets related to BSR and RP for the public network. debugging pim rp send *0.3303375 Sysname PIM/7/RP:(public net): PIM ver 2 CRP sending 10.1.1.2 -> 19.1.1.1 on Vlan-interface10 (S01409) *0.3303375 Sysname PIM/7/RP:(public net): C-RP 12.12.12.
PKI debugging commands debugging pki Use debugging pki to enable PKI debugging. Use undo debugging pki to disable PKI debugging. Syntax debugging pki { all | certificate access-control-policy | error | request | retrieval | verify } undo debugging pki { all | certificate | error | request | retrieval | verify } Default PKI debugging is disabled. Views User view Default command level 1: Monitor level Parameters all: Specifies all types of IPsec debugging.
Table 131 Output from the debugging pki error command Field Description SCEP receive message: wrong MIME content type Type of the content of the SCEP packet received from the CA is not correct. Error while sending message Error occurred when SCEP packet is sent. PKCS#7 develope: reason Reason for PKCS#7 de-encapsulation failure. PKCS#7 develope: illegal size of payload The size of the payload in the de-encapsulated packet is illegal.
Figure 2 IE client certificate # Configure a certificate attribute group and a certificate attribute-based access control policy on the device.
*0.35980270 Sysname PKI/7/PKI_Debug:PKI_Certificate: the attribute 3 Match in attribute group '1'. Check the next attribute. *0.35980425 Sysname PKI/7/PKI_Debug:PKI_Certificate: Match the rule id: 1, action: permit in access control policy '1'. Access Permit // The client certificate passed the certificate validation after it matched Attributes 1, 2, and 3 in the certificate attribute group. # Disable HTTPS service and add a new certificate attribute group.
attribute group '1'. Check the next attribute. *0.38011540 Sysname PKI/7/PKI_Debug:PKI_Certificate: the attribute 2 Match in attribute group '1'. Check the next attribute. *0.38011706 Sysname PKI/7/PKI_Debug:PKI_Certificate: the attribute 3 Match in attribute group '1'. Check the next attribute. *0.38011860 Sysname PKI/7/PKI_Debug:PKI_Certificate: Match the rule id: 2, ac tion: permit in access control policy '2'.
%Aug 8 11:23:55:266 2006 Sysname PKI/4/Update_CA_Cert:Update CA certificates of the Domain crt successfully. // The PKI module updated the CA certificate of PKI domain crt successfully. %Aug 8 11:23:55:266 2006 Sysname PKI/4/CA_Cert_Retrieval:Retrieval CA certificates of the domain crt successfully. // The PKI module obtained the CA certificate of PKI domain crt successfully. *0.514266 Sysname PKI/7/PKI_Debug:Certificate-1 // The PKI module obtained the first certificate of the certificate chain. *0.
Saving the local certificate to device...... Done! // The local certificate was successfully enrolled and saved to the device. %Aug 8 11:24:10:407 2006 Sysname PKI/4/Local_Cert_Request:Request local certificate of the domain crt successfully. *0.529407 Sysname PKI/7/PKI_Debug:SCEP receive message: Server returned status code 200 // The PKI module received a response from the CA server. *0.529407 Sysname PKI/7/PKI_Debug:PKCS#7 develope: reading outer PKCS#7 *0.
// The PKI module de-encapsulated the PKCS#7 file and found that the payload size is 1036 bytes. # Enable certificate request debugging. Output similar to the following example is generated: [Sysname] pki retrieval-certificate ca domain crt // Retrieval the CA certificate. Retrieving CA/RA certificates. Please wait a while...... *0.179079 Sysname PKI/7/PKI_Debug:SCEP send message:IP = 0x85040404 // The PKI module sent a packet to the CA through SCEP.
• The port number of the SCEP protocol is 446. • The path of the CA server is 6953bf7fb5b1cf514376243ce67ebed1209c292a. • The SCEP ID is 038DE310FA1404F6781ED659158FE236. *0.244438 Sysname PKI/7/PKI_Debug:PKCS#7 envelope: creating inner PKCS#7 // The PKI module was creating inner PKCS#7 file. *0.244438 Sysname PKI/7/PKI_Debug:PKCS#7 envelope: pkcs10 request 231 bytes // The size of the certificate request message in PKCS#10 format is 231 bytes. *0.
// The signature is OK. *0.245079 Sysname PKI/7/PKI_Debug:PKCS#7 develope: finding signed attributes *0.245079 Sysname PKI/7/PKI_Debug:PKCS#7 develope: finding attribute transId *0.245079 Sysname PKI/7/PKI_Debug:PKCS#7 develope: allocating 32 bytes for attribute *0.245094 Sysname PKI/7/PKI_Debug:PKCS#7 develope: reply transaction id: 038DE310FA1404F6781ED659158FE236 // The PKI module found signed attribute transId and allocated 32 bytes for it. *0.
FEADA5CA 028289AB CE95C6B6 E687639D // The serial number of the certificate is FEADA5CA 028289AB CE95C6B6 E687639D. Issuer: C=cn O=aaa OU=software CN=sec // The above shows the DN of the issuer. Subject: CN=crtSysname3 // The above shows the Entity DN of the certificate being validated. *0.745641 Sysname PKI/7/PKI_Debug:CN=crtSysname3 *0.745657 Sysname PKI/7/PKI_Debug:error at 0 depth:subject issuer mismatch *0.745657 Sysname PKI/7/PKI_Debug:Check the last certificate self signed. *0.
O=hhh OU=software CN=sec Verify result: ok [Sysname] %Aug 8 11:28:00:266 2006 Sysname PKI/4/Verify_Cert:Verify certificate CN=sec,OU=sof tware,O=hhh,C=cn of the domain crt successfully. *0.759266 Sysname PKI/7/PKI_Debug:Check the last certificate self signed. *0.759282 Sysname PKI/7/PKI_Debug:Lookup certificate issuers and push into chain *0.759282 Sysname PKI/7/PKI_Debug:Check certificates purpose. *0.759282 Sysname PKI/7/PKI_Debug:Check certificates trust. *0.
The trusted CA's finger print is: MD5 fingerprint:8FDC C669 7A95 5505 8C0A 8633 818D A0A1 SHA1 fingerprint:8CCD 07AD 6C9A 229B 3378 2430 F038 A142 D175 190E Is the finger print correct?(Y/N): *Aug 21 10:37:09:493 2006 Sysname PKI/7/PKI_Debug:SCEP receive message: Server returned status code 200y Saving CA/RA certificates chain, please wait a moment...... CA certificates retrieval success. // The PKI module obtained the CA certificate successfully.
*Aug 21 10:37:26:993 2006 Sysname PKI/7/PKI_Debug:PKCS#7 develope: reason: Transaction not permitted or supported *Aug 21 10:37:26:993 2006 Sysname PKI/7/PKI_Debug:PKCS#7 develope: illegal size of payload // The size of the payload after PKCS#7 decapsulation is invalid. *Aug 21 10:37:27:16 2006 Sysname PKI/7/PKI_Debug:Certificate enroll failed, error code is 72 // The PKI module failed to request a local certificate because the key pair was already used.
Policy-based routing debugging commands The output description tables in this document only contain fields and messages that require an explanation. debugging ip policy-based-route Use debugging ip policy-based-route to enable policy-based routing (PBR) debugging. Use undo debugging ip policy-based-route to disable PBR debugging. Syntax debugging ip policy-based-route undo debugging ip policy-based-route Default PBR debugging is disabled.
a. Field b. Description q. tos r. Type of service. s. pktlen t. u. pktid v. Packet ID. w. protocol x. Upper layer protocol. y. s z. Source address. aa. d bb. Destination address. Packet length. Examples # Enable PBR debugging. The output in this example was created when the following conditions exist: • Configure PBR on Ethernet 1/0 to allow forwarding packets with a length from 10 to 100 bytes to Serial 2/0.
Port security debugging commands The port security module name is identified as "PORTSEC" in debugging messages. Some information in this chapter is device type specific. Devices in this chapter are categorized depending on their IRF capability and support for interface cards that use independent processors for forwarding traffic, as shown in Table 1.
Default Port security debugging is disabled. Views User view Default command level 1: Monitor level Parameters all: Specifies all types of port security debugging. error: Specifies port security error debugging. event: Specifies port security event debugging. slot slot-number: Specifies a card by its slot number. (Distributed devices—In standalone mode.) slot slot-number: Specifies the ID of an IRF member device. (Centralized IRF devices.
Field Description Failed to Alloc memory for RPC message, when request backuping MAC Address table to slave board! Failed to alloc memory for RPC message, when request backuping BlockMac table to slave board. RPC failed, when backup BlockMac table to new board!(RPC wrong=ErrorCode) RPC failed, the BlockMac table is not synchronized to the new board. The device failed to allocate memory for RPC messages when it was backing up the MAC address table to other cards except the active MPU.
Field Description Failed to malloc for RPC message, when request getting BlockMac number from a board. The device failed to allocate memory for RPC messages when it tried to obtain the number of blocked MAC addresses. Failed to malloc for RPC message, when request getting BlockMac address from a board. The device failed to allocate memory for RPC messages when it tried to obtain blocked MAC addresses. MIB:OUITable proc block number is wrong. MIB operation of OUI MAC entries.
Field Description Broadcast send a MAC address sync msg, IfIndex:IFINDEX, Status :STATUS, VlanID :VLANID, Mac-addr: MacAddress, OpType: OPTYPE. Self slot is SELFSLOTID. The port security module broadcast a MAC address synchronization message. The port security module received an RPC message for displaying port information of the current card. (Distributed devices/distributed IRF devices.
Error: Can not operate security MAC address for current port mode is not autoLearn! *Apr 28 23:54:57:975 2000 Sysname PORTSEC/7/Event:InvalidPort,InvalidAuth,ExecID=1,Optype=2, Calling portsec cfg module... // The device called the port security configuration module. *Apr 28 23:54:57:976 2000 Sysname PORTSEC/7/Event:InvalidPort,InvalidAuth,CFG:Portsec SecureMAC table process begin... // The port security module tried to add a secure MAC entry.
Portal debugging commands The output description tables in this document only contain fields and messages that require an explanation. debugging portal Use debugging portal to enable portal debugging. Use undo debugging portal to disable portal debugging.
Table 138 Output from the debugging portal tcp-cheat command Field Description Source Source information flag. MAC Source MAC address of TCP connection. VLAN ID of Source VLAN of TCP connection. PortIndex Index of source port of TCP connection. changed from STATUS_A to STATUS_B The status is changed from status A to status B. Table 2 describes output fields and messages for the debugging portal packet command.
Field Description Processing message-name Processing the message named message-name. 1 user index IP ip-address User index is index, and IP address is ip-address. recv message-name from ACM Received a message named message-name from ACM module. recv message-name from DRV Received a message named message-name from the driver. Table 4 describes output fields and messages for the debugging portal acl command.
Field Description VCPU ID Virtual CPU ID. DPIfIndex Data plane interface index. SrcIP Source IP address. SrcMask Source IP address mask. SrcMac Source MAC address. DstIP Destination IP address. DstMask Destination IP address mask. Flow Flow tag of packets. AuthorACL Authorization ACL number. Operation type: Operation • • DstPort ADD: Adds an ACL. DEL: Deletes an ACL. Destination port number. Table 5 describes output fields and messages for the debugging portal error command.
*Dec 30 15:19:53:168 2007 Sysname TCPCHEAT/7/TCPCHEAT_DEBUG:State of connection with source IP 2.2.2.3 is LISTEN! // The status of the connection with source IP 2.2.2.3 is LISTEN. *Dec 30 15:19:53:177 2007 Sysname TCPCHEAT/7/TCPCHEAT_DEBUG:State of connection with source IP 2.2.2.3 changed from LISTEN to SYN_RECVD! // The status of the connection with source IP 2.2.2.3 changed from LISTEN to SYN_RECVD. *Dec 30 15:19:53:507 2007 Sysname TCPCHEAT/7/TCPCHEAT_DEBUG:State of connection with source IP 2.2.2.
Portal packet attribute list: [ 8 Port [ 10 BAS-IP ] [ 27] [AR49-45-vlan-00-0000@vlan] ] [ 6] [2.2.2.1] // The attribute list carried in the packet: [Attribute 8 Port ] [Length: 27] [Value: AR49-45-vlan-00-0000@vlan] [Attribute 10 BAS-IP ] [Length: 6] [Value: 2.2.2.
// In the ACM module, the user with index 1 changed to ONLINE state. The user online time was refreshed. # On a portal-enabled device, enable portal ACL debugging. Perform portal authentication.
Mask = 0.0.0.0 Protocol = 0 MAC = 0000-0000-0000 Interface = any VLAN = 2 // The source information of the portal rule. Destination: IP = 192.168.0.111 Mask = 255.255.255.255 TCP Port = 0 Context = 0x00000000,0xffffffff // The destination information of the portal rule. *0.24586800 Sysname PORTAL/8/PORTAL_DEBUG:Slot=4;Add ACL driver return:0 Inbound interface = all Type = dynamic Action = permit // The upper layer software assigned a portal rule to the driver successfully.
IP = 0.0.0.0 Mask = 0.0.0.0 TCP Port = 0 Context = 0xffffffff,0xffffffff // The destination information of the portal rule. The output in the following examples was created on portal-enabled devices with a multi-core CPU. # Enable portal ACL debugging on the device.
// The data plane received parameter information. The operation is to add a portal rule. *Dec 15 16:47:28:600 2008 Sysname PORTAL_D/7/DP_PORTAL_DEBUG:Slot=3; Added permit ACL: Successfully! RuleID = 0x00000001 Sequence = 0x00000001 // The portal module successfully added a permit rule. Rule ID is 1, and rule sequence is 1. *Dec 15 16:47:28:600 2008 Sysname PORTAL_D/7/DP_PORTAL_DEBUG:Slot=3; Portal enabled on the interface! // Portal was enabled on the interface.
undo debugging portal server Default Portal server debugging is disabled. Views User view Default command level 1: Monitor level Usage guidelines Table 6 describes output fields and messages for the debugging portal server command. Table 143 Output from the debugging portal server command Field User user-ip is being detected, index = index, detection mode = mode. Description Detecting user user-ip. index indicates the user index. mode indicates the detection mode: • • • 0: No detection.
Field Description Received async connection is not for local server. The received asynchronous Socket connection is not for the local server. Failed to move connection from WS to portal. Failed to move the Socket connection from the Web service module to the portal server. Failed to write message to connection queue. Failed to write data to the Socket connection queue. Received invalid msg for connection. Received a message indicating that the Socket connection is invalid.
Field Description Failed to get MAC information (IP ip-addr). Failed to get MAC information of the user whose IP address is ip-addr. Examples # On a device enabled with local portal server, enable portal server debugging.
*Jan 10 16:19:40:531 2008 Sysname PORTAL/7/PORTAL_DEBUG: User 2.2.20.4 sent ICMP detection request packet. *Jan 10 16:19:40:734 2008 Sysname PORTAL/7/PORTAL_DEBUG: User 2.2.20.4 received ICMP detection response packet. // The portal server performed the ICMP detection. *Jan 10 16:21:31:609 2008 Sysname PORTAL/7/PORTAL_DEBUG: Received connection 1 from WS. *Jan 10 16:21:31:609 2008 Sysname PORTAL/7/PORTAL_DEBUG: Processing connection.
POS terminal access debugging commands The output description tables in this document only contain fields and messages that require an explanation. debugging posa all Use debugging posa all to enable all POS access debugging. Use undo debugging posa all to disable all POS access debugging. Syntax debugging posa all [ terminal terminal-id | app app-id ] undo debugging posa all [ terminal terminal-id | app app-id ] Default All POS access debugging is disabled.
debugging posa event Use debugging posa event to enable POS access event debugging. Use undo debugging posa event to disable POS access event debugging. Syntax debugging posa event [ terminal terminal-id | app app-id ] undo debugging posa event [ terminal terminal-id | app app-id ] Default POS access event debugging is disabled. Views User view Default command level 2: System level Parameters terminal-id: Specifies a POS terminal by its ID in the range of 1 to 255.
App 2: Received control message of deleting app. // POS access received a control message that application 2 is deleted. *Jul 30 19:44:18:392 2008 posa POSA/7/EVENT: App 2: Received control message of disconnecting by app. // POS access received a control message that all connections to application 2 are terminated. debugging posa error Use debugging posa error to enable POS access error debugging. Use undo debugging posa error to disable POS access error debugging.
Field Failed to create terminal instance by terminal(n) when accepting connect from socket(i). Failed to set socket(i) to asyn mode when connecting to app. App n: Failed to create linking timer by socket(i). Failed to get terminal template by terminal(n) when updating the statistics. Failed to unbind the application template (n) with interface (m) in command line.
Field Failed to delete application (n) because of sending control message unsuccessfully. Failed to create fcm terminal template in terminal table because of illegal interface index (n). Failed to create flow terminal template because of illegal workmode on interface. Failed to remalloc memory when echoing global configuration. Failed to get template by ifindex(m) when echoing interface configuration.
Parameters receive: Specifies debugging for BPDU packets received. send: Specifies debugging for BPDU packets sent. terminal-id: Specifies a POS terminal by its ID in the range of 1 to 255. app-id: Specifies a POS application by its ID in the range of 1 to 31. Usage guidelines Use the receive or send, and terminal or app keywords to enable or disable packet debugging in a specific direction on a specific POS terminal or application. Special fields of the POS packet include the following: • STX.
PPP debugging commands The output description tables in this document only contain fields and messages that require an explanation. PPP debugging commands debugging ppp Use debugging ppp to enable PPP debugging. Use undo debugging ppp to disable PPP debugging.
core: PPP kernel event debugging. ip: IP packet debugging. ipcp: IP Control Protocol (IPCP) debugging. ipv6: IPv6 packet debugging. ipv6cp: IPv6 Control Protocol (IPv6CP) debugging. ipx: IPX debugging. ipxcp: IPX Control Protocol (IPXCP) debugging. lcp: PPP Link Control Protocol (CCP) debugging. lqc: PPP link quality control (LQC) debugging. mp: MP debugging. mpls-multicast: MPLS multicast debugging. mpls-unicast: MPLS unicast debugging. mplscp: MPLS Control Protocol (MPLSCP) debugging.
Field Description Receive-Configure-Request(RCR+,RCR-) A Configure-Request packet was received from the peer. RCR+ indicates that the request is acceptable and a Configure-Ack should be sent back. RCR- indicates that the request is unacceptable, and a Configure-Nak or Configure-Rej should be sent back. Receive-Configure-Ack(RCA) A valid Configure-Ack packet was received from the peer. The packet is a positive response to a configuration request.
*0.784906 Sysname PPP/8/debug2: PPP State Change: Serial2/0 LCP : initial --> starting // LCP moved from the initial state to the starting state. *0.784906 Sysname PPP/8/debug2: PPP Event: Serial2/0 LCP Lower Up Event state starting // A lower layer up event was reported for LCP. The LCP state machine was in the starting state. *0.784906 Sysname PPP/8/debug2: PPP State Change: Serial2/0 LCP : starting --> reqsent // LCP moved from the starting state to the reqsent state. *0.
Default command level 1. Monitor level Parameters all: All types of PPPoE client debugging. data: Debugging for data information of the PPPoE client at the session stage. error: Error debugging for the PPPoE client. event: Event debugging for the PPPoE client. packet: Debugging for data information of the PPPoE client at the discovery stage. verbose: Detailed information debugging for the PPPoE client. interface-type interface-number: Specifies an interface by its type and number.
Field Description Len Packet length. Dest MAC Addr Destination MAC address. Src MAC Addr Source MAC address. Ver Version. Type Type. Code Packet Type. Session ID Session number. Tag Service-Name Internet service provider. Tag Host-Uniq A particular unique request of a host. Tag AC-Name The field used for preventing denial of service attacks. Examples # Enable all types of PPPoE client debugging.
64 66 34 | df4 *Aug 21 11:05:25:202 2007 Sysname PPPOEC/7/debugging:Ethernet1/1: PPPoE Client I N Discovery packet (PADO), Len = 60 // Interface Ethernet 1/1 received a discovery-stage packet.
UT, Len = 36 00 0f e2 29 ad f4 00 0f e2 00 00 03 88 64 11 00 00 01 00 10 c0 21 01 00 00 0e 01 04 05 d4 05 06 3c f3 37 79 >> Dest MAC Addr: 000f.e229.adf4, Session Stage, Ver=1, Src MAC Addr: 000f.e200.0003 Type=1, Session ID=1 *Aug 21 11:05:26:550 2007 Sysname PPPOEC/7/debugging:Ethernet1/1: Dialer1:0 was bound to Dialer1 for PPPoE Session // Interface Ethernet 1/1 sent a session-stage packet. debugging pppoe-server Use debugging pppoe-server to enable PPPoE server debugging.
Field Description session Session ID. Table 7 describes the output fields and messages for the debugging pppoe-server event command. Table 152 Output from the debugging pppoe-server event command Field Description IN Incoming packets at the PPPoE discovery stage. OUT Outgoing packets at the PPPoE discovery stage. PADI The PPPoE active discovery initiation (PADI) packet. PADO The PPPoE active discovery offer (PADO) packet. PADR The PPPoE active discovery request (PADR) packet.
// Interface GigabitEthernet 1/1 sent a discovery-stage packet. *Dec 8 07:59:44:407 2006 Sysname PPPOE/7/debug2: 2006-12-8 7:59:44.405: PPPoE :GigabitEthernet1/1 IN discovery packet, len 60 00 0f e2 29 ad f4 00 0f e2 00 00 03 88 63 11 19 00 00 00 21 01 01 00 00 01 03 00 02 00 01 01 02 00 13 51 75 69 64 77 61 79 30 30 30 66 65 32 32 39 61 64 66 34 00 13 51 75 69 64 77 *Dec 8 07:59:44:407 2006 Sysname PPPOE/7/debug2: 2006-12-8 7:59:44.
PTP debugging commands The output description tables in this document only contain fields and messages that require an explanation. debugging ptp Syntax debugging ptp { all | error | event | frame [ receive | send ] [ verbose ] | fsm | timer } undo debugging ptp { all | error | event | frame [ receive | send ] [ verbose ] | fsm | timer } Default PTP debugging is disabled. Views User view Default command level 1: Monitor level Parameters all: All types of debugging for PTP. error: PTP error debugging.
Table 155 Output from the debugging ptp fsm command Field Description Entered PRS PTP entered role selection state. Entered SEND_PDELAY_REQ state in PDelayReq state machine. The Pdelay_Req state machine is in Pdelay request sending state. Entered WAITING_FOR_PDELAY_RESP state in PDelayReq state machine. The Pdelay_Req state machine is in waiting for the Pdelay response state. Entered SENT_PDELAY_RESP state in PDelayResp state machine.
QoS debugging commands The output description tables in this document only contain fields and messages that require an explanation. NOTE: Support for the following commands depends on the device model. debugging dar Use debugging dar to enable DAR debugging. Use undo debugging dar to disable DAR debugging. Syntax debugging dar { all | error | event | packet } undo debugging dar { all | error | event | packet } Default DAR debugging is disabled.
Table 157 Output from the debugging dar event command Field Description Failed to write queue DAR failed to write information queue during traffic accounting. Failed to trigger an event DAR failed to trigger an event after writing information queue successfully. Failed to remove timer DAR failed to remove the timer for traffic accounting. Session count has reached the upper limit The number of sessions monitored by DAR reached the configured upper limit.
Default command level 2: System level Parameters all: All types of P2P debugging. error: P2P error debugging. event: P2P event debugging. Usage guidelines Table 4 describes output fields and messages for the debugging p2p error command. Table 159 Output from the debugging p2p error command Field Description Failed to parse the protocol string P2P failed to resolve the protocol string. Failed to get statistics information.
*Dec 6 20:11:56:343 2007 Sysname P2P/7/P2P_Error: Invalid signature file content. // Contents of the signature file were invalid. # Enable P2P event debugging when no protocol group exists on the device. Output similar to the following example is generated when a user performs these tasks: • Creates protocol group 64. • Adds protocol 1, protocol 2, protocol 3, and protocol 4 to protocol group 64.
Default All types of QoS debugging are disabled. Views User view Default command level 1: Monitor level debugging qos car Use debugging qos car to enable CAR debugging. Use undo debugging qos car to disable CAR debugging. Syntax debugging qos car undo debugging qos car Default CAR debugging is disabled. Views User view Default command level 1: Monitor level Usage guidelines Table 5 describes output fields and messages for the debugging qos car command.
Use undo debugging qos cbq to disable CBQ debugging. Syntax debugging qos cbq { af | be | ef } undo debugging qos cbq { af | be | ef } Default CBQ debugging is disabled. Views User view Default command level 1: Monitor level Parameters af: AF queue debugging. be: BE queue debugging. ef: EF queue debugging. Usage guidelines Table 6 describes output fields and messages for the debugging qos cbq af command.
• The packets from Router C are classified into three classes according to their DSCP values. A QoS policy is applied to the packets in the outbound direction of the egress port of Router A: Applying assured forwarding (AF) policy for the packets with the DSCP value AF11 or AF21, setting the minimum to bandwidth percentage to 5%. Applying expedited forwarding (EF) policy to the packets with the DSCP value EF, setting the maximum bandwidth percentage to 30%.
Field Description Getting queue statistic error QoS failed to obtain queue statistics. Global fragment pre-drop count error A global count error occurred on an interface enabled with fragment pre-drop. Cutting packet header error on QoS input process QoS failed to remove a header of an incoming packet. Pasting packet header error on QoS input process QoS failed to add a header to an incoming packet. debugging qos event Use debugging qos event to enable QoS event debugging.
*Dec 17 13:28:53:962 2007 Sysname QOS/7/QOS_Debug: QOS_Event: Module 3200000 enable filling IP user tag outbound, and the current IPv4 reference counter is 1. // Module 3200000 enabled filling IP user tags in the outbound direction. The current IPv4 reference counter is 1 (IPv4 has referenced the function for one time). *Dec 17 13:28:53:962 2007 Sysname QOS/7/QOS_Debug: QOS_Event: Module 3200000 enable filling IP user tag outbound, and the current IPv6 reference counter is 1.
Default Debugging for packet matching in QoS is disabled. Views User view Default command level 1: Monitor level Usage guidelines Table 9 describes output fields and messages for the debugging qos match command. Table 164 Output from the debugging qos match command Field Description Match match-type were ignored for match-type did not match the packet. The match criterion based on match-type was ignored because the match-type did not match the packet type.
Table 165 Output from the debugging qos remark command Field Description Failed to remark packet, for remark remark-type did not match the packet type. QoS failed to re-mark the packets because remark-type did not match the packet type. Examples # Enable debugging for packet remarking in QoS on Router A.
Voice RADIUS debugging commands The output description tables in this document only contain fields and messages that require an explanation. debugging voice radius Use debugging voice radius to enable voice RADIUS debugging. Use undo debugging voice radius to disable voice RADIUS debugging. Syntax debugging voice radius { all | error | event | fsm | timer | trace } undo debugging voice radius { all | error | event | fsm | timer | trace } Default Voice RADIUS debugging is disabled.
• Field • Description • Disconnect Media Error • Disconnecting the media failed. Table 2 describes output fields and messages for the debugging voice radius event command. Table 167 Output from the debugging voice radius event command • Field • Description • VORDS ---> CMC • Commands from the voice RADIUS module to the CMC. • CMC [1] ---> VORDS [2] • Messages from CMC 1 to voice RADIUS module 2.
• Field • Description • Dial Flow Type: Card • The dialing process is a card number/password process (two-stage dialing process). • Dial Flow CallerNumber Type: • The dialing process is a caller number process (two-stage dialing process). • Dial Flow VoiceCaller Type: • The dialing process is a caller number process with IVR (two-stage dialing process). Table 3 describes output fields and messages for the debugging voice radius fsm command.
• Field • RDS_AUTHEN_TIMER • RDS_AUTHOR_TIMER • RDS_ACCT_TIMER • RDS_MDACONN_TIMER • RDS_TALK_TIMER • RDS_LASTMINUTE_TIMER • Description • Timer that specifies a wait for an Authentication_OK message. • Timer that specifies a wait for an Authorization_OK message. • Timer that specifies a wait for an Accounting_OK message. • Timer that specifies a wait for a Media_Connect_OK message. • Timer that specifies the call duration. • Timer that specifies the last minute of a call.
Examples The output in the following examples was created when the following conditions exist: • A two-stage dialing process is configured for voice RADIUS. • The access number is 201. • The card number/password authentication, authorization, and accounting functions are enabled. # Enable voice RADIUS event debugging. debugging voice radius event Enable VORDS event debugging functions *Nov 17 17:40:30:86 2006 Sysname VORDS/7/VOICE: VORDS_EVENT: VORDS ---> CMC Start Trigger.
VORDS_EVENT: CARD_RCV] VORDS ---> IVR: IfIndex: [0x2c0030] Play Voice. VORDS ID: [0] State: [RDS_STATE_ Tone ID: [1300] // A prompt was played for a card number. *Nov 17 17:40:38:68 2006 Sysname VORDS/7/VOICE: VORDS_EVENT: Receive IVR Message. VORDS ID: [0] Argument: [1] // A prompt response message was received from the interactive voice response (IVR). The result of prompt play was 1, which means that the prompt was played successfully.
*Nov 17 17:40:48:775 2006 Sysname VORDS/7/VOICE: VORDS_EVENT: CMC [0] ---> VORDS [0] Msg: CMC_INFORMATION DTMFChar. *Nov 17 17:40:49:285 2006 Sysname VORDS/7/VOICE: VORDS_EVENT: CMC [0] ---> VORDS [0] Msg: CMC_INFORMATION DTMFChar. *Nov 17 17:40:49:645 2006 Sysname VORDS/7/VOICE: VORDS_EVENT: CMC [0] ---> VORDS [0] Msg: CMC_INFORMATION DTMFChar. *Nov 17 17:40:50:125 2006 Sysname VORDS/7/VOICE: VORDS_EVENT: CMC [0] ---> VORDS [0] Msg: CMC_INFORMATION DTMFChar.
// The information above is the called number collection process. After the user pressed the dial terminator #, the called number collection process ended. *Nov 17 17:41:05:187 2006 Sysname VORDS/7/VOICE: VORDS_EVENT: VORDS ---> DRV Stop DTMF Detect. VORDS ID: [0] IfIndex:[0x2c0030] // DTMF detection stopped. *Nov 17 17:41:05:187 2006 Sysname VORDS/7/VOICE: VORDS_EVENT: ALKING] VORDS ---> IVR Stop Voice.
// The prompt was played to notify the voice RADIUS module that the called user had hung up. *Nov 17 17:41:20:161 2006 Sysname VORDS/7/VOICE: VORDS_EVENT: Receive IVR Message. VORDS ID: [0] Argument: [1] *Nov 17 17:41:20:161 2006 Sysname VORDS/7/VOICE: VORDS_EVENT: VORDS ---> DRV Start DTMF Detect. VORDS ID: [0] IfIndex: [0x2c0030] // DTMF detection was enabled to start collecting the digits of a called number.
*Nov 17 17:44:39:919 2006 Sysname VORDS/7/VOICE: VORDS_FSM: [1] RDS_STATE_PWD_RCV ---> RDS_STATE_CALLED_RCV // The state of voice RDS_STATE_CALLED_RCV. RADIUS module changed from RDS_STATE_PWD_RCV to RDS_STATE_CALLED_RCV to *Nov 17 17:44:50:402 2006 Sysname VORDS/7/VOICE: VORDS_FSM: [1] RDS_STATE_CALLED_RCV ---> RDS_STATE_TALKING // The state of voice RDS_STATE_TALKING.
*Nov 17 17:45:51:891 2006 Sysname VORDS/7/VOICE: VORDS_TIMER: [2] [RDS_STATE_CARD_RCV] Delete Timer: RDS_INTERNUM_TIMER ID: 306 *Nov 17 17:45:51:891 2006 Sysname VORDS/7/VOICE: VORDS_TIMER: [2] [RDS_STATE_CARD_RCV] 10000 ms Create Timer: RDS_INTERNUM_TIMER ID: 246 Length: *Nov 17 17:45:52:311 2006 Sysname VORDS/7/VOICE: VORDS_TIMER: [2] [RDS_STATE_CARD_RCV] Delete Timer: RDS_INTERNUM_TIMER ID: 246 *Nov 17 17:45:52:311 2006 Sysname VORDS/7/VOICE: VORDS_TIMER: [2] [RDS_STATE_CARD_RCV] 10000 ms Create
336 *Nov 17 17:45:59:901 2006 Sysname VORDS/7/VOICE: VORDS_TIMER: [2] [RDS_STATE_PWD_RCV] 410 Create Timer: RDS_INTERNUM_TIMER ID: Length: 10000 ms *Nov 17 17:46:00:291 2006 Sysname VORDS/7/VOICE: VORDS_TIMER: [2] [RDS_STATE_PWD_RCV] Delete Timer: RDS_INTERNUM_TIMER ID: 410 *Nov 17 17:46:00:292 2006 Sysname VORDS/7/VOICE: VORDS_TIMER: [2] [RDS_STATE_PWD_RCV] 414 Create Timer: RDS_INTERNUM_TIMER ID: Length: 10000 ms *Nov 17 17:46:00:621 2006 Sysname VORDS/7/VOICE: VORDS_TIMER: [2] [RDS_STATE_PWD_R
VORDS_TIMER: [2] [RDS_STATE_CALLED_RCV] Delete Timer: RDS_INTERNUM_TIMER ID: 499 *Nov 17 17:46:09:261 2006 Sysname VORDS/7/VOICE: VORDS_TIMER: [2] [RDS_STATE_CALLED_RCV] Length: 10000 ms Create Timer: RDS_INTERNUM_TIMER ID: 524 *Nov 17 17:46:10:190 2006 Sysname VORDS/7/VOICE: VORDS_TIMER: [2] [RDS_STATE_CALLED_RCV] Delete Timer: RDS_INTERNUM_TIMER ID: 524 *Nov 17 17:46:10:191 2006 Sysname VORDS/7/VOICE: VORDS_TIMER: [2] [RDS_STATE_CALLED_RCV] Length: 10000 ms Create Timer: RDS_INTERNUM_TIMER ID:
VORDS_TIMER: [2] [RDS_STATE_CALLED_RCV] Delete Timer: RDS_FIRSTNUM_TIMER ID: 965 // The timer for waiting for the first digit of a called number was deleted. *Nov 17 17:46:26:78 2006 Sysname VORDS/7/VOICE: VORDS_TIMER: [2] [RDS_STATE_RELEASE] 10000 ms Create Timer: RDS_ACCT_TIMER ID: 738 Length: // A timer was created, specifying a wait time for a PSTN_Accounting_Stop_ACK message.
*Nov 17 17:47:31:739 2006 Sysname VORDS/7/VOICE: VORDS_TRACE: VORDS [3] ---> AAA [7] Msg: ACCT_START Acct Type: 2 Calling Num: 200 Called Num: 400 Access Num: 201 // A VoIP_Accounting_Start message was sent to the AAA module. *Nov 17 17:47:31:790 2006 Sysname VORDS/7/VOICE: VORDS_TRACE: AAA [7] ---> VORDS [3] Msg: ACCT_OK Acct Type: 2 // A VoIP_Accounting_OK message was received. Accounting succeeded.
RIP debugging commands The output description tables in this document only contain fields and messages that require an explanation. debugging rip Use debugging rip to enable RIP debugging. Use undo debugging rip to disable RIP debugging. Syntax debugging rip process-id undo debugging rip process-id Default RIP debugging is disabled. Views User view Default command level 1: Monitor level Parameters process-id: Specifies a RIP process by its ID in the range of 1 to 65535.
Parameters process-id: Specifies a RIP process by its ID in the range of 1 to 65535. Examples # Enable brief RIP debugging on Router A. The output in this example was created when the following conditions exist: • Router A is connected to Router B through Ethernet 1/1. • RIP is enabled on Router A and Router B. debugging rip 1 brief *Nov 24 15:28:22:814 2006 Sysname RM/6/RMDEBUG: RIP 1 : Sending v2 response on Ethernet1/1 from 40.0.0.
Table 171 Output from the debugging rip event command Field Description RIP sent a message to BFD successfully. • msg-type—BFD message type. • pkt-type—Packet type, which can be Echo or RIP-BFD: Success to send msg. Message Type msg-type, Pkt Type pkt-type, Src IP Address src-ip, Src IFIndex if-index, Nbr IP Address nbr-ip. Control. • src-ip—Source IP address for session establishment. • if-index—Interface index maintained by route management. • nbr-ip—Neighbor IP address for session establishment.
debugging rip 1 event *Nov 24 15:42:35:836 2006 Sysname RM/3/RMDEBUG: TRIP 1 : TRIP's neighbour changes to NEW status. // The state of the neighbor of TRIP process 1 changed to NEW. *Nov 24 15:42:35:836 2006 Sysname RM/3/RMDEBUG: TRIP 1 : TRIP's neighbour changes to UP status. // The state of the neighbor of TRIP process 1 changed to UP. *Nov 24 15:42:35:868 2006 Sysname RM/3/RMDEBUG: TRIP 1 : TRIP's neighbour changes from UP to FULL status.
*Nov 24 15:57:46:32 2006 Sysname RM/6/RMDEBUG: nexthop 0.0.0.0, cost 1, tag 0 AFI 2, dest 50.0.0.2/255.255.255.255, // The first route entry was output. *Nov 24 15:57:46:32 2006 Sysname RM/6/RMDEBUG: 0.0.0.0, cost 1, tag 0 AFI 2, dest 50.0.0.0/255.0.0.0, nexthop // The second route entry was output. *Nov 24 15:57:46:32 2006 Sysname RM/6/RMDEBUG: nexthop 0.0.0.0, cost 1, tag 0 AFI 2, dest 110.0.0.1/255.255.255.255, // The third route entry was output.
*Nov 24 15:45:45:537 2006 Sysname RM/6/RMDEBUG: 8 Packet : vers 2, cmd request, length // The version of the sent request packet is 2 and the packet length is 8 bytes. *Nov 24 15:45:45:564 2006 Sysname RM/6/RMDEBUG: TRIP 1 : Receive response on Serial2/0 from 50.0.0.2 // TRIP process 1 received a response packet from 50.0.0.2 on Serial 2/0.
Field Description Sequence: seq-number (number) Sequence number of MD5 authentication (RFC 2453). Sequence: seq-number Sequence number of MD5 authentication (RFC 2082). invalid authentication The values of the 0xFFFF and 0x01 fields in the MD5 authentication (RFC 2082) packets are incorrect. Therefore, the authentication is invalid. Examples # Enable RIP received packet debugging on Ethernet 1/1 of Router A.
*Nov 24 15:45:45:564 2006 Sysname RM/6/RMDEBUG: TRIP 1 : Receive response on Serial2/0 from 50.0.0.2 // TRIP process 1 received a response packet from 50.0.0.2 on Serial 2/0. *Nov 24 15:45:45:564 2006 Sysname RM/6/RMDEBUG: length 8, sequence num 0 Packet : vers 2, cmd response (FLUSH), // The version of the received response packet (with FLUSH) is 2. The packet length is 8 bytes and the sequence number is 0. debugging rip send Use debugging rip send to enable sent RIP packet debugging.
*Nov 24 15:57:46:32 2006 Sysname RM/6/RMDEBUG: RIP 1 : Sending response on interface Ethernet1/1 from 40.0.0.2 to 224.0.0.9 // RIP process 1 sent a response packet on Ethernet 1/1 from 40.0.0.2 to 224.0.0.9. *Nov 24 15:57:46:32 2006 Sysname RM/6/RMDEBUG: 84 Packet : vers 2, cmd response, length // The version of the response packet is 2 and the packet length is 84 bytes.
debugging rip timer Use debugging rip timer to enable RIP timer debugging. Use undo debugging rip timer to disable RIP timer debugging. Syntax debugging rip process-id timer undo debugging rip process-id timer Default RIP timer debugging is disabled. Views User view Default command level 1: Monitor level Parameters process-id: Specifies a RIP process by its ID in the range of 1 to 65535. interface interface-type interface-number: Specifies an interface by its type and number.
RIPng debugging commands debugging ripng Use debugging ripng to enable all RIPng debugging. Use undo debugging ripng to disable all RIPng debugging. Syntax debugging ripng process-id undo debugging ripng process-id Default No RIPng debugging is enabled. Views User view Default command level 1: Monitor level Parameters process-id: Specifies a RIPng process by its ID in the range of 1 to 65535. debugging ripng brief Use debugging ripng brief to enable RIPng brief debugging.
• Ethernet 1/1 of Router A is connected to Ethernet 1/1 of Router B. • RIPng is enabled on Ethernet 1/1 of Router A and on Ethernet 1/1 of Router B. debugging ripng 1 brief *Nov 22 21:17:37:662 2006 Sysname RM/6/RMDEBUG:RIPng 1 : Sending v1 response on Ethernet1/1 to FF02::9 with 2 RTEs // RIPng process 1 sent a response packets of version 1 on Ethernet 1/1 to FF02::9 with two RTEs.
// RIPng process 1 was disabled on Ethernet 1/1. # Redistribute direct routes into RIPng process 1 on Router A. [Sysname-ripng-1] import-route direct *Nov 23 13:29:24:640 2006 Sysname RM/6/RMDEBUG:RIPng 1 : Rebuilding of Database has started *Nov 23 13:29:24:640 2006 Sysname RM/6/RMDEBUG:RIPng 1 : Database has been rebuilt // RIPng process 1 rebuilt the database. debugging ripng packet Use debugging ripng packet to enable RIPng packet debugging.
// The third route entry was output. *Nov 24 13:49:51:130 2006 Sysname RM/6/RMDEBUG:RIPng 1 : Sending response message on Ethernet1/1 to FF02::9 // RIPng process 1 sent a response packet on Ethernet 1/1 to FF02::9. *Nov 24 13:49:52:302 2006 Sysname RM/6/RMDEBUG: Packet : vers 1, cmd response, length 44 // The version of the sent response packet is 1 and the packet length is 44 bytes. *Nov 24 13:49:52:317 2006 Sysname RM/6/RMDEBUG: Dest 22::/64, cost 16, tag 0 // The first route entry was output.
*Nov 22 21:41:02:00 2006 Sysname RM/6/RMDEBUG: Dest 50::/64, cost 1, tag 0 // The second route entry was output. debugging ripng send Use debugging ripng send to enable RIPng sent packet debugging. Use undo debugging ripng send to disable RIPng sent packet debugging. Syntax debugging ripng process-id send [ interface interface-type interface-number ] undo debugging ripng process-id send [ interface interface-type interface-number ] Default RIPng sent packet debugging is disabled.
Syntax debugging ripng process-id timer undo debugging ripng process-id timer Default RIPng timer debugging is disabled. Views User view Default command level 1: Monitor level Parameters process-id: Specifies a RIPng process by its ID in the range of 1 to 65535. Examples # Enable RIPng timer debugging on the device running RIPng. debugging ripng 1 timer *Oct 18 13:38:32:406 2006 Sysname RM/6/RMDEBUG:RIPng 1 : Periodic timer expired // The periodic update timer of RIPng process 1 expired.
RMON debugging commands The output description tables in this document only contain fields and messages that require an explanation. debugging rmon Use debugging rmon to enable RMON debugging. Use undo debugging rmon to disable RMON debugging. Syntax debugging rmon [ error | info | warning ] undo debugging rmon [ error | info | warning ] Views User view Default command level 1: Monitor level Parameters error: Specifies RMON error debugging. info: Specifies RMON info debugging.
Field Description invalid index index in real time on slave board Invalid RMON table entry index was found on the standby MPU during real-time backup. index—Index of an RMON table entry. etherStatsEntry index aged at time-hour:time-minute:time-second in real time on slave board The Ethernet statistics entry aged out during real-time data backup on the standby MPU.
Field Description sample no statistics at interface-name for etherStatsEntry index by synchronous RPC RMON performed a synchronous RPC call to sample statistics for the Ethernet statistics entry on the Ethernet interface, but the call did not collect any statistics. the status of etherStatsEntry index changed to underCreation for interface-removed event Removal of an interface card caused all its interfaces to be removed.
[Sysname] rmon alarm 1 1.3.6.1.2.1.6.3.0 5 absolute rising-threshold 100 1 falling-threshold 20 1 [Sysname] *Apr 27 10:12:24:208 2000 Sysname RMON/7/INFO: add alarmEntry 1 through CLI or NMS *Apr 27 10:12:24:216 2000 Sysname RMON/7/INFO: the No. 1 sample for alarmEntry 1 // RMON created the RMON alarm entry and sampled the monitored object for the first time.
RPR debugging commands The output description tables in this document only contain fields and messages that require an explanation. debugging rpr error Use debugging rpr error to enable RPR error debugging. Use undo debugging rpr error to disable RPR error debugging. Syntax debugging rpr error [ interface interface-type interface-number ] undo debugging rpr error [ interface interface-type interface-number ] Default RPR error debugging is disabled.
Field Description Errors occurred to topology calculation. The String field describes the detailed reason for errors: • MAC duplicate error: ringlet ringlet_id hop hop_id duplicate with local station, which means the MAC address of the hop hop-id of ringlet ringlet-id overlaps with that of the local station. ringlet-id is 0 or 1, and hop-id ranges from 1 to 254.
Parameters general: Specifies debugging for general RPR events, including protection state changes, miscabling changes, and port UP/DOWN events. ringlet-selection: Specifies debugging for RPR ringlet selection events. interface interface-type interface-number: Specifies a port by its type and number. Usage guidelines Table 2 describes output fields and messages for the debugging rpr event command.
Field Description The String1 field indicates the direction (east or west) The String2 field indicates the event that occurred: RPR_Event: On interface-type interface-number, at String1 span, String2 • • • • • Interface up—An interface went up. Interface down—An interface went down. Mistake cable is occurred—Miscabling occurred. Protection status is changed—Protection state changed. MATE status is changed—The state of the MATE port changed.
# Enable RPR general event debugging. The output in this example was created when two stations form a closed RPR ring. When you remove the optical fiber connected to the west physical port, output similar to the following example is generated: debugging rpr event general int rpr 1 *Jun 5 11:38:40:211 2007 Sysname RPR/7/EVT_SPAN:Slot=3; RPR_Event: On RPR1, at west span, Protection status is changed! // On interface RPR1, the protection state on the west span changed.
Field Description The String field indicates the current state machine: RPR_Fsm: On interface-type interface-number. String is running • • • • WTR state machine. receive TP frame state machine—Receiving TP frames. transmit TP frame state machine—Transmitting TP frames. topology DB update state machine stage1—Stage 1 of topology database updating. • topology DB update state machine stage2—Stage 2 of topology database updating. • • • • protection state machine. topology validation state machine.
# Enable RPR state machine debugging on interface RPR1. The output in this example was created when two stations form a closed RPR ring. When you shut down the west physical port, output similar to the following example is generated: debugging rpr fsm interface rpr 1 *Jun 5 11:50:04:203 2007 Sysname RPR/7/FSM:Slot=5; RPR_Fsm: On RPR1, at west span, protection state machine: in stage POST // On interface RPR1, the protection state machine was in the POST stage on the west span.
Usage guidelines If no packet type is specified, debugging for all types of RPR packets is enabled. If neither receive nor send is specified, debugging for both received and sent RPR packets is enabled. Table 4 describes output fields and messages for the debugging rpr packet command. Table 178 Output from the debugging rpr packet command Field Description RPR packet debugging information: RPR_Packet: On interface-type interface-number, at String1 span, String2 packet was String3.
ttl:255 ri:0 fe:0 ft:1 sc:3 we:0 parity:0 DA:ffff-ffff-ffff SA:000f-e246-18af ttlBase:255 ef:0 fi:0 ps:0 so:0 res:0 controlType:2 controlVersion:0 esw:1 ese:1 psw:5 pse:4 wc:0 jp:1 seqnum:29 // On interface RPR1, all contents of TP frames burst-sent to the west span were displayed. NOTE: For TP frames and TC frames, the sending function is mutually exclusive with the burst-sending function. debugging rpr timer Use debugging rpr timer to enable RPR timer debugging.
Table 179 Output from the debugging rpr timer command Field Description Timer event. The String1 field indicates the timer name: RPR_Timer: On interface-type interface-number, String1 timer String2 • • • • • • • • • • • • TD-Fast—TD fast timer. TD-Slow—TD slow timer. TC-Fast—TC fast timer. TC-Slow—TC slow timer. ATD—ATD timer. holdoff—Holdoff timer. keepalive—Keepalive timer. stability—Stability timer. instability—Instability timer. Oam—OAM timer. IdleIsolateDetect—IdleIsolateDetect timer.
RRPP debugging commands The output description tables in this document only contain fields and messages that require an explanation. debugging rrpp Use debugging rrpp to enable RRPP debugging. Use undo debugging rrpp to disable RRPP debugging.
• If both the domain-id argument and the ring-id argument are specified, the operation applies to the specified ring in the specified domain. Table 1 describes output fields and messages for the debugging rrpp error command. Table 180 Output from the debugging rrpp error command Field Description The memory operation failed. Failed to String String field value: • allocate memory—Applying for dynamic memory failed. • copy MBUF to PDU—Copying Ethernet network packets to the PDU failed.
Field Description A port received error packets. The reason is also given. The string field describes the errors: • illegal RRPP packet Length—The RRPP packet length field in the RRPP packet received is invalid. • illegal RRPP packet version—The RRPP version of the RRPP packet received is invalid. • illegal RRPP PDU Length—The RRPP PDU length field in the RRPP packet received is invalid. • illegal domain ID—The domain ID in the RRPP packet received is invalid.
Table 3 describes output fields and messages for the debugging rrpp fast-detect-fsm command. Table 182 Output from the debugging rrpp fast-detect-fsm command Field Description State machine information of a specific RRPP ring in a specific RRPP domain. Domain domain-id ring ring-id String • domain-id—RRPP domain ID. • ring-id—RRPP ring ID. • String field value: RX FSM—Receive state machine. TX FSM—Transmit state machine. RXTX FSM—Receive and transmit state machines.
Table 184 Output from the debugging rrpp fsm command Field Description Information about a specific state machine of a specific ring in a specific domain: Domain domain-id ring ring-id String • domain-id—RRPP domain ID. • ring-id—RRPP ring ID. • The String1 field represents the state machine type: Master Node FSM—Master node state machine. Transit Node FSM—Transit node state machine. Edge Node FSM—Edge node state machine. Assistant-Edge Node FSM—Assistant edge node state machine.
Table 185 Output from the debugging rrpp packet command Field Description Packet debugging information: Port interface-type interface-number String1 packet of domain domain-id ringring-id.(Length: ULONG, Type: String2) String3 • interface-type interface-number—Interface type and interface number. • String1—Packet direction. This field can be Rcvd (indicating received packets) or Send (indicating sent packets). • • • • domain-id—RRPP domain ID. ring-id—RRPP ring ID. ULONG—Packet length.
*0.8306346 Sysname RRPP/7/RRPPFSM: Domain 1 ring 2 RX FSM. Previous state is Complete. Current state is Failed. Transition event is Fast-FailTimer-Expired. // The receive state machine of ring 2 in RRPP domain 1 transited from Complete to Failed because the Fast-Fail timer expired. # Enable debugging for fast-detection packets. The output in this example was created when the following conditions exist: • A transit node is configured, which uses the default timer settings.
Port Ethernet1/1 Send packet of domain1 ring1.(Length: 64, Type: Health) 99 0b 00 40 01 05 00 01 00 01 00 00 00 00 00 00 01 11 00 01 00 03 00 00 00 00 00 00 00 00 00 00 00 00 00 00 00 00 00 00 00 00 00 00 00 00 00 00 00 00 00 00 00 00 00 00 00 00 00 00 00 00 00 00 // The primary port Ethernet 1/1 sent a Health packet. *0.9497605 Sysname RRPP/8/RRPPPKT: Port Ethernet1/2 Rcvd packet of domain1 ring1.
RSH debugging commands debugging rsh Use debugging rsh to enable RSH debugging. Use undo debugging rsh to disable RSH debugging. Syntax debugging rsh undo debugging rsh Default RSH debugging is disabled. Views User view Default command level 1: Monitor level Examples # Enable RSH debugging. When RSH is used to execute an OS command of a remote host, output similar to the following example is generated: debugging rsh rsh 1.1.1.1 command cd c: Trying 1.1.1.1 ...
Service loopback group debugging commands The service loopback group module name is identified as "SLBG" in debugging messages. debugging service-loopback Use debugging service-loopback to enable service loopback group debugging. Use undo debugging service-loopback to disable service loopback group debugging. Syntax debugging service-loopback { all | error | event } undo debugging service-loopback { all | error | event } Default Service loopback group debugging is disabled.
Session management debugging commands The output description tables in this document only contain fields and messages that require an explanation. debugging session aging-process Use debugging session aging-process to enable debugging for session aging queue processing of session management. Use undo debugging session aging-process to disable debugging for session aging queue processing of session management.
Table 186 Output from the debugging session aging-process command Field Description Protocol states: State: PRO_STATE • • • • • • • • • • • • • • • TCP_SYN_OPEN. TCP_ESTABLISHED. TCP_FIN_CLOSE. TCP_CLOSED. UDP_OPEN. UDP_READY. ICMP_REQUEST. ICMP_REPLY. RAWIP_OPEN. RAWIP_READY. ICMP_ERROR_CTRL. PRO_FTP. PRO_DNS. PRO_MSN. PRO_QQ. Session extension state: Extent-State • • • • • • • • • WAITACK0. WAITACK1. WAITACK2. INACTIVE. ACCELERATE. HALF_SESSION. KEEP_ALIVE. PERSIST. DYNAMIC.
Syntax debugging session engine { all | event | error } undo debugging session engine { all | event | error } Default Debugging for session engine is disabled. Views User view Default command level 1: Monitor level Parameters all: Specifies all types of debugging for session engine. event: Specifies debugging for session engine events. error: Specifies debugging for session engine errors. Usage guidelines Table 2 describes output fields and messages for the debugging session engine event command.
Field Description Msg: Message name. Received message from DRIVER: msg • CREAT_SESSION. • UPDATE_SESSION. • DELETE_SESSION. process: Processing action. Succeeded in process according to DRIVER message • creating a session. • updating a session. • deleting a session. Pro Session protocol. ID Session ID. VPN Index VPN index in the HASH entry. HASH entry: Init IP/Port --> resp IP/Port VpnIndex Initiator IP/port -> Responder IP/port VPN index. Inverse HASH entry.
1.1.1.2/ 100 <-- 2.2.2.2/ 100 0 // The session engine received a SESSION_END_NOTIFY message sent by the session management module. *Apr 26 14:41:36:517 2007 Sysname SESS_DP/7/ENGINE: EVENT: Succeeded in notifying DRIVER to process the event: A session was created. Pro:UDP ID:57 Initiator: IP/ Port Responder: IP/ Port VPN Index 1.1.1.2/ 100 --> 2.2.2.2/ 100 0 1.1.1.2/ 100 <-- 2.2.2.2/ 100 0 // The session engine received a message from the driver.
Default command level 1: Monitor level Parameters all: Specifies all types of debugging for extended information. event: Specifies debugging for events of extended information. error: Specifies debugging for errors of extended information. acl acl-number: Uses an ACL to match sessions for logging. The acl-number argument specifies an ACL number in the range of 2000 to 3999. If you execute the command multiple times with different ACLs, the most recent command takes effect.
Tuple5: 192.168.0.92/8-->192.168.1.58/3840(ICMP) // The service module NAT added extended information to the session successfully. debugging session packet-process Use debugging session packet-process to enable debugging for packet processing of session management. Use undo debugging session packet-process to disable debugging for packet processing of session management.
Syntax debugging session relation { all | event | error } undo debugging session relation { all | event | error } Default Debugging for session relation table of session management is disabled. Views User view Default command level 1: Monitor level Parameters all: Specifies all types of debugging for session relation table. event: Specifies debugging for session relation table events. error: Specifies debugging for session relation table errors.
*Mar 26 09:17:54:112 2007 Sysname DPSESSIO/7/RELATION: LocalTuple3: 192.168.1.8/4780 : GlobalTuple3: 192.168.1.8/4780 (TCP) Delete time out // Session management deleted the relation entry due to timeout. *Mar 24 18:22:13:476 2007 Sysname DPSESSIO/7/RELATION: Error: Memory not enough for relation // Session management failed to create a relation entry due to insufficient resources.
Examples # Enable debugging for session table entries on the device with security module enabled. When a ping packet passes through the device, output similar to the following example is generated: debugging session session-table all *Mar 24 18:15:47:164 2007 Sysname DPSESSIO/7/TABLE: Tuple5(EVENT): 192.168.0.2/8-->192.168.1.58/3840(ICMP) Operation:Create // Session management created an ICMP session entry. *Mar 24 18:15:47:174 2007 Sysname DPSESSIO/7/TABLE: Tuple5(FSM): 192.168.0.2/8-->192.168.
Examples # Enable debugging for session log processing events on the device that supports session management. debugging session log proc event # Configure session logging output thresholds. system-view [Sysname] session log time-active 10 [Sysname] session log packets-active 1 # Enable the session logging function. [Sysname] interface gigabitethernet 1/1 [Sysname-GigabitEthernet1/1] session log enable inbound # Ping the device from 192.168.0.2.
debugging session log active-flow Use debugging session log active-flow to enable debugging for active flow. Use undo debugging session log active-flow to disable debugging for active flow. Syntax debugging session log active-flow { all | event | error } undo debugging session log active-flow { all | event | error } Default Debugging for active flow is disabled. Views User view Default command level 1: Monitor level Parameters all: Specifies all types of debugging for active flow.
// Session management added the created ICMP session to the active-flow queue. # Delete the created ICMP session. When the created ICMP session is deleted successfully, output similar to the following messages is generated: reset session source-ip 192.168.0.2 *Mar 26 08:50:24:568 2007 Sysname DPSESS/7/active-flow: Tuple5: 192.168.0.2/8-->192.168.1.58/3840(ICMP) Event: Session removed from the active-flow queue. // Session management deleted the ICMP session from the active-flow queue.
SIP debugging commands The output description tables in this document only contain fields and messages that require an explanation. debugging voice sip Use debugging voice sip to enable SIP debugging. Use undo debugging voice sip to disable SIP debugging. Syntax debugging voice sip { all | error | event | message | stack | timer } undo debugging voice sip { all | error | event | message | stack | timer } Default SIP debugging is disabled.
Field Description Send Prack Request Failed SIP failed to send a Prack request. Send AccpAlerting message Failed SIP failed to send an AccpAlerting message. Send AccpConnect Failed SIP failed to send an AccpConnect message. Send SipConnectAck Failed SIP failed to send a SipConnectAck message. Find XXX error SIP failed to get the XXX field. Create AppRspMsg error SIP failed to create an AppRspMsg message. Cannot find the exist SIP CCB The existing SIP CCB was not found.
Field Description Failed to get authentication because failed to calculation response code. SIP failed to obtain authentication information because it failed to calculate response code. Failed to calculate authentication because the number of authentication header is negative. SIP failed to calculate authentication information because the number of authentication headers was negative. Build Options: Failed add To IE to Msg. Build Options: SIP failed to add To IE to Msg.
Field Description Find Codec in Prack Request Failed SIP failed to get the codec in the Prack request. Stack --> Adapter : Prack Response Adapter layer received a response to the Prack request from the protocol stack. Stack --> Adapter : Update Request Adapter layer received an Update request from the protocol stack. Stack --> Adapter : Update Response Adapter layer received a response to the Update request from the protocol stack.
Field Description Adapter --> Stack : Alerting Request Adapter layer sent an Alerting request to the protocol stack. Adapter --> Stack : Connect Request Adapter layer sent a Connect request to the protocol stack. Adapter --> Stack : ConnectAck Request Adapter layer sent a ConnectAck request to the protocol stack. Adapter --> Stack : Information Request Adapter layer sent an Info request to the protocol stack.
*May 12 11:14:58:515 2007 Sysname SIP/7/VOICE: SIP_Event: Stack --> Adapter : Setup Ack // The protocol stack sent a Setup Ack to the SIP adapter layer. *May 12 11:14:58:550 2007 Sysname SIP/7/VOICE: SIP_Event: Stack --> Adapter : Alerting Indication. // The protocol stack sent an Alerting message to the SIP adapter layer. *May 12 11:14:58:550 2007 Sysname SIP/7/VOICE: SIP_Event: SIP --> CMC : Accp Alerting. // SIP sent an ACCP Alerting message to CMC.
SIP_Event: SIP ChangeCodec Media Channel: SIP ChangeCodec Media Channel Success! // SIP changed the codec type for the media channel. *May 12 11:15:03:473 2007 Sysname SIP/7/VOICE: SIP_Event: SIP Delete Media Channel: SIP Delete Media Channel Success! // SIP deleted a media channel. *May 12 11:15:03:473 2007 Sysname SIP/7/VOICE: SIP_Event: SIP Create Meida Channel: Local Address = 3.1.1.19 : 16598 Remote Address = 3.1.1.29 : 16560 Encode Type = 11 // SIP set up a media channel.
*May 12 11:31:51:284 2007 Sysname SIP/7/VOICE: Stack--->NetWork: INVITE sip:3000@3.1.1.29:5060 SIP/2.0 Via: SIP/2.0/UDP 3.1.1.19:5060;branch=z9hG4bK9558081c4a9 Call-ID: 178990f081c919d4752cd8e19558081c109@3.1.1.19 From: ;tag=9558081c To: CSeq: 1 INVITE Contact:
Allow: ACK,BYE,CANCEL,INFO,INVITE,NOTIFY,PRACK,REFER,REGISTER,UPDATE Date: Sat, 12 May 2007 11:30:14 GMT Content-Length: 158 Content-Type: application/sdp v=0 o=H3C 1073742102 1073742102 IN IP4 3.1.1.29 s=Sip Call c=IN IP4 3.1.1.29 t=0 0 m=audio 16564 RTP/AVP 18 a=rtpmap:18 G729/8000 a=fmtp:18 annexb=no // The originating device received a 183 (Session Progress) response from the terminating device. *May 12 11:31:54:801 2007 Sysname SIP/7/VOICE: NetWork--->Stack: SIP/2.0 200 OK Via: SIP/2.0/UDP 3.1.1.
Content-Length: 0 // The originating device sent an ACK to confirm the reception of the 200 response. *May 12 11:33:04:949 2007 Sysname SIP/7/VOICE: Stack--->NetWork: BYE sip:3000@3.1.1.29:5060 SIP/2.0 Via: SIP/2.0/UDP 3.1.1.19:5060;branch=z9hG4bKd66d95e966e Call-ID: 178990f081c919d4752cd8e19558081c109@3.1.1.19 From: ;tag=9558081c To:
SIP_Timer: Stop Timer ulTimerGroup = 4 ulIndex = 144 *May 12 18:12:53:824 2007 Sysname SIP/7/VOICE: SIP_Timer: Stop Timer ulTimerGroup = 3 ulIndex = 144 *May 12 18:12:53:824 2007 Sysname SIP/7/VOICE: SIP_Timer: Start Timer ulTimerGroup = 4 ulIndex = 144 ulDuration = 64000 *May 12 18:12:53:858 2007 Sysname SIP/7/VOICE: SIP_Timer: Stop Timer ulTimerGroup = 4 ulIndex = 144 *May 12 18:12:53:954 2007 Sysname SIP/7/VOICE: SIP_Timer: Start Timer ulTimerGroup = 4 ulIndex = 144 ulDuration = 256000 *May 12 18:12:
SIP_Timer: Stop Timer ulTimerGroup = 16 ulIndex = 13 *May 12 18:13:00:643 2007 Sysname SIP/7/VOICE: SIP_Timer: Start Timer ulTimerGroup = 16 ulIndex = 13 ulDuration = 1800000 *May 12 18:13:00:643 2007 Sysname SIP/7/VOICE: SIP_Timer: Stop Timer ulTimerGroup = 22 ulIndex = 13 *May 12 18:13:00:786 2007 Sysname SIP/7/VOICE: SIP_Timer: Start Timer ulTimerGroup = 22 ulIndex = 13 ulDuration = 5000 *May 12 18:13:00:896 2007 Sysname SIP/7/VOICE: SIP_Timer: Stop Timer ulTimerGroup = 4 ulIndex = 144 *May 12 18:13:
SIP_Timer: Stop Timer ulTimerGroup = 4 ulIndex = 145 *May 12 18:13:06:638 2007 Sysname SIP/7/VOICE: SIP_Timer: Stop Timer ulTimerGroup = 3 ulIndex = 145 *May 12 18:13:06:738 2007 Sysname SIP/7/VOICE: SIP_Timer: Stop Timer ulTimerGroup = 16 ulIndex = 13 *May 12 18:13:06:888 2007 Sysname SIP/7/VOICE: SIP_Timer: Start Timer ulTimerGroup = 3 ulIndex = 145 ulDuration = 5000 *May 12 18:13:11:562 2007 Sysname SIP/7/VOICE: SIP_Timer: Timer out ulTimerGroup = 3 ulIndex = 145 debugging voice ssm call Use debugging
Enable SSM CALL ALL debugging functions *Sep 7 16:38:37:637 2007 Sysname SSM/7/VOICE: SSM_INFO [CALL_SSA]: General: Succeed in getting a free element from the list. Additional: Call control block ID is 42. // The SSA module got a free element from the list as the control block (ID: 42) for the current call. *Sep 7 16:38:37:638 2007 Sysname SSM/7/VOICE: SSM_INFO [CALL_SSA]: General: Received message from the stack. Additional: The message type is SetupInd. Call control block ID is 42.
SSM_FSM [CALL_SLC]: CALLCTRL: State changed from INIT to CALLINPROGRESS.(ObjectID = 15) // The state machine CALLCTRL transitioned from INIT to CALLINPROGRESS. *Sep 7 16:38:38:102 2007 Sysname SSM/7/VOICE: SSM_PRIM [CALL_SSA]: Receive UCM Setup reject message. // The SSA module received the UCM_SETUPREJ message. *Sep 7 16:38:38:253 2007 Sysname SSM/7/VOICE: SSM_INFO [CALL_SSA]: General: Succeed in sending the network message. Additional: Method type is INVITE, status code is 407.
// The SLC module stopped an 8000-ms timer. *Sep 7 16:38:39:362 2007 Sysname SSM/7/VOICE: SSM_INFO [CALL_SLC]: General: Succeed in getting a free element from the list. Additional: Call control block ID is 22. // The SSA module got a free element from the list as the call control block (ID: 22). *Sep 7 16:38:39:573 2007 Sysname SSM/7/VOICE: SSM_EVENT [CALL_SLC]: CALLSRV: Received event UCMSETUPREQ while at state IDLE.
SSM_TIMER [CALL_SLC]: Start Timer: Type = 6, Group = 6, Index = 23, Length = 16000 // The SLC module started a timer, with the value set to 16000 ms. *Sep 7 16:38:40:934 2007 Sysname SSM/7/VOICE: SSM_FSM [CALL_SLC]: CALLCLT: State changed from IDLE to SETUP.(ObjectID = 23) // The state machine CALLCLT transitioned from IDLE to SETUP. *Sep 7 16:38:41:135 2007 Sysname SSM/7/VOICE: SSM_FSM [CALL_SLC]: CALLCTRL: State changed from CALLINPROGRESS to INCALL.
*Sep 7 16:38:42:02 2007 Sysname SSM/7/VOICE: SSM_PRIM [CALL_SSA]: Send UCM Setup ACK message. // The SSA module sent a UCM_SETUPACK message to the SLC module. *Sep 7 16:38:42:153 2007 Sysname SSM/7/VOICE: SSM_INFO [CALL_SSA]: General: Succeed in sending the network message. Additional: Method type is INVITE. // The SSA module sent an INVITE to the network side. *Sep 7 16:38:42:304 2007 Sysname SSM/7/VOICE: SSM_PRIM [CALL_SLC]: Receive UCM Setup ACK message.
CALLCTRL: Received event CALLTRANSMIT while at state INCALL.(ObjectID = 15) // The state machine CALLCTRL received a CALLTRANSMIT event in the INCALL state. *Sep 7 16:38:43:422 2007 Sysname SSM/7/VOICE: SSM_EVENT [CALL_SLC]: CALLSRV: Received event CCALERTINGIND while at state SETUP.(ObjectID = 22) // The state machine CALLSRV received a CCALERTING event in the SETUP state. *Sep 7 16:38:43:624 2007 Sysname SSM/7/VOICE: SSM_PRIM [CALL_SLC]: Send UCM Alerting message.
Receive UCM Alerting message. // The SSA module received a UCM_ALERTING message. *Sep 7 16:38:44:793 2007 Sysname SSM/7/VOICE: SSM_INFO [CALL_SSA]: General: Succeed in sending the network message. Additional: Method type is INVITE, status code is 183. // The SSA module sent a 183 response to the network side for the INVITE method. *Sep 7 16:38:45:50 2007 Sysname SSM/7/VOICE: SSM_INFO [CALL_SSA]: General: Received message from the stack. Additional: The message type is ConnectInd.
*Sep 7 16:38:45:901 2007 Sysname SSM/7/VOICE: SSM_TIMER [CALL_SLC]: Stop Timer: Type = 6, Group = 6, Index = 22, Length = 150000 // The SLC module stopped a 150000-ms timer. *Sep 7 16:38:46:103 2007 Sysname SSM/7/VOICE: SSM_TIMER [CALL_SLC]: Start Timer: Type = 6, Group = 6, Index = 22, Length = 16000 // The SLC module started a timer, with the value set to 16000 ms. *Sep 7 16:38:46:254 2007 Sysname SSM/7/VOICE: SSM_FSM [CALL_SLC]: CALLSRV: State changed from ALERTING to CONNECT.
// The SSA module received a ConnectCfm message from the network side. *Sep 7 16:38:47:272 2007 Sysname SSM/7/VOICE: SSM_PRIM [CALL_SSA]: Send UCM Connect ACK message. // The SSA module sent a UCM_CONNECTACK message to the SLC module. *Sep 7 16:38:47:423 2007 Sysname SSM/7/VOICE: SSM_PRIM [CALL_SLC]: Receive UCM Connect ACK message. // The SLC module received the UCM_CONNECTACK message.
// The SLC module started a timer, with the value set to 3600000 ms. *Sep 7 16:38:48:642 2007 Sysname SSM/7/VOICE: SSM_TIMER [CALL_SLC]: Stop Timer: Type = 6, Group = 6, Index = 22, Length = 16000 // The SLC module stopped a 16000-ms timer. *Sep 7 16:38:48:743 2007 Sysname SSM/7/VOICE: SSM_FSM [CALL_SLC]: CALLSRV: State changed from CONNECT to ACTIVE.(ObjectID = 22) // The state machine CALLSRV transitioned from CONNECT to ACTIVE.
Examples # Enable all types of debugging for location service. When a user with number 2002 initiates a registration request with authentication information to the SIP server, output similar to the following example is generated: debugging voice ssm lsm all Enable SSM LSM ALL debugging functions *Sep 8 15:22:09:239 2007 Sysname SSM/7/VOICE: SSM_INFO [LSM]: General: Succeed in getting the user information. Additional: The number is 2002.
Default Debugging for SIP server probe is disabled. Views User view Default command level 2: System level Parameters probe: Enables debugging for SIP server probe. all: Specifies all types of debugging. error: Specifies error debugging. event: Specifies event debugging. fsm: Specifies finite state machine debugging. info: Specifies information debugging. prim: Specifies primitive debugging. timer: Specifies timer debugging. Examples # Enable all types of debugging for SIP server probe.
*Sep 8 17:44:18:530 2007 Sysname SSM/7/VOICE: SSM_PRIM [PROBE_SSA]: Receive UCM Options request message. // The SSA module received the UCM_OPTIONSREQ message. *Sep 8 17:44:18:530 2007 Sysname SSM/7/VOICE: SSM_INFO [PROBE_SSA]: General: Succeed in sending the network message. Additional: Method type is OPTIONS. // The SSA module sent an OPTIONS request to the network side. *Sep 8 17:44:33:95 2007 Sysname SSM/7/VOICE: SSM_INFO [PROBE_SSA]: General: Received message from the stack.
Stop Timer: Type = 1, Group = 1, Index = 0, Length = 64000 // The SLC module stopped a 64000-ms probe timer. *Sep 8 17:44:33:96 2007 Sysname SSM/7/VOICE: SSM_TIMER [PROBE_SLC]: Start Timer: Type = 1, Group = 1, Index = 0, Length = 64000 // The SLC module started a probe timer, with the value set to 64000 ms. debugging voice ssm reg Use debugging voice ssm reg to enable debugging for SIP server registration service.
// The SSA module received a REGISTER request from the protocol stack. *Sep 7 16:51:40:326 2007 Sysname SSM/7/VOICE: SSM_PRIM [REG_SSA]: Send UCM Register request message. // The SSA module sent the REGISTER request to the UCM module. *Sep 7 16:51:40:327 2007 Sysname SSM/7/VOICE: SSM_PRIM [REG_SLC]: Receive UCM Register request message. // The SLC module received the REGISTER request from the UCM module.
*Sep 7 16:51:40:577 2007 Sysname SSM/7/VOICE: SSM_PRIM [REG_SSA]: Receive UCM Register response message. // The SSA module received the REGISTER response from the UCM module. *Sep 7 16:51:40:687 2007 Sysname SSM/7/VOICE: SSM_INFO [REG_SSA]: General: Succeed in sending the network message. Additional: Method type is REGISTER, status code is 401. // The SSA module sent a REGISTER response (401) to the network side.
SSM_TIMER [REG_SLC]: Start Timer: Type = 3, Group = 3, Index = 33, Length = 3600000 *Sep 7 16:51:42:37 2007 Sysname SSM/7/VOICE: SSM_FSM [REG_SLC]: REGISTER: State changed from REGISTERING to ACTIVE.(ObjectID = 33) *Sep 7 16:51:42:297 2007 Sysname SSM/7/VOICE: SSM_PRIM [REG_SSA]: Receive UCM Register response message. *Sep 7 16:51:42:397 2007 Sysname SSM/7/VOICE: SSM_INFO [REG_SSA]: General: Succeed in sending the network message. Additional: Method type is REGISTER, status code is 200.
*Sep 8 17:50:24:554 2007 Sysname SSM/7/VOICE: SSM_TIMER [STACK]: Start Timer: Type = 2550, Group = 10, Index = 74, Length = 64000 // The protocol stack started a timer, with the value set to 64000 ms.
Start Timer: Type = 2805, Group = 10, Index = 75, Length = 256000 *Sep 8 17:50:25:149 2007 Sysname SSM/7/VOICE: SSM_TIMER [STACK]: Start Timer: Type = 0, Group = 11, Index = 22, Length = 128000 *Sep 8 17:50:25:303 2007 Sysname SSM/7/VOICE: SSM_TIMER [STACK]: Stop Timer: Type = 2805, Group = 15, Index = 22, Length = 600000 *Sep 8 17:50:25:410 2007 Sysname SSM/7/VOICE: SSM_TIMER [STACK]: Start Timer: Type = 2805, Group = 15, Index = 22, Length = 600000 *Sep 8 17:50:25:604 2007 Sysname SSM/7/VOICE: SS
Start Timer: Type = 0, Group = 8, Index = 129, Length = 30000 *Sep 8 17:50:26:899 2007 Sysname SSM/7/VOICE: SSM_TIMER [STACK]: Stop Timer: Type = 2805, Group = 15, Index = 21, Length = 600000 *Sep 8 17:50:27:20 2007 Sysname SSM/7/VOICE: SSM_TIMER [STACK]: Start Timer: Type = 2805, Group = 15, Index = 21, Length = 600000 *Sep 8 17:50:27:132 2007 Sysname SSM/7/VOICE: SSM_TIMER [STACK]: Start Timer: Type = 1020, Group = 12, Index = 21, Length = 120000 *Sep 8 17:50:27:355 2007 Sysname SSM/7/VOICE: SSM_
Content-Length: 239 Content-Type: application/sdp v=0 o=HUAWEI 1073741844 1073741844 IN IP4 100.1.1.188 s=Sip Call c=IN IP4 100.1.1.188 t=0 0 m=audio 16396 RTP/AVP 18 8 0 4 a=rtpmap:18 G729/8000 a=fmtp:18 annexb=no a=rtpmap:8 PCMA/8000 a=rtpmap:0 PCMU/8000 a=rtpmap:4 G723/8000 // The server received an INVITE request from the network side. *Sep 8 17:40:32:562 2007 Sysname SSM/7/VOICE: SSM_PACKET [STACK]: Stack--->NetWork SIP/2.0 100 Trying Via: SIP/2.0/UDP 192.168.1.
c=IN IP4 100.1.1.188 t=0 0 m=audio 16396 RTP/AVP 18 8 0 4 a=rtpmap:18 G729/8000 a=fmtp:18 annexb=no a=rtpmap:8 PCMA/8000 a=rtpmap:0 PCMU/8000 a=rtpmap:4 G723/8000 // The server sent an INVITE to the network side. *Sep 8 17:40:32:622 2007 Sysname SSM/7/VOICE: SSM_PACKET [STACK]: NetWork--->Stack SIP/2.0 183 Session Progress Via: SIP/2.0/UDP 100.1.1.188:5060;branch=z9hG4bK423ec20d0a4 Call-ID: 3411a7fdb824639cd797366b423ec20d@100.1.1.188 From:
Content-Type: application/sdp v=0 o=HUAWEI 1073741846 1073741846 IN IP4 100.1.1.185 s=Sip Call c=IN IP4 100.1.1.185 t=0 0 m=audio 16392 RTP/AVP 18 a=rtpmap:18 G729/8000 a=fmtp:18 annexb=no // The server sent the 183 response to the network side. *Sep 8 17:40:42:465 2007 Sysname SSM/7/VOICE: SSM_PACKET [STACK]: NetWork--->Stack SIP/2.0 200 OK Via: SIP/2.0/UDP 100.1.1.188:5060;branch=z9hG4bK423ec20d0a4 Call-ID: 3411a7fdb824639cd797366b423ec20d@100.1.1.188 From:
Date: Sat, 08 Sep 2007 17:39:43 GMT Content-Length: 167 Content-Type: application/sdp v=0 o=HUAWEI 1073741848 1073741848 IN IP4 100.1.1.185 s=Sip Call c=IN IP4 100.1.1.185 t=0 0 m=audio 16392 RTP/AVP 18 a=rtpmap:18 G729/8000 a=fmtp:18 annexb=no // The server sent the 200 response to the network side. *Sep 8 17:40:42:484 2007 Sysname SSM/7/VOICE: SSM_PACKET [STACK]: NetWork--->Stack ACK sip:Sip-Server@100.1.1.188:5060;user=phone;ttl=0 SIP/2.0 Via: SIP/2.0/UDP 100.1.1.
Syntax debugging voice ssm sub { all | error | event | fsm | info | prim | timer } undo debugging voice ssm sub { all | error | event | fsm | info | prim | timer } Default Debugging for SIP server subscription service is disabled. Views User view Default command level 2: System level Parameters sub: Enables debugging for SIP server subscription service. all: Specifies all types of debugging. error: Specifies error debugging. event: Specifies event debugging.
SSM_PRIM [SUB_SSA]: Send UCM Subscribe request message. // The SSA module sent a subscription request to the UCM module. *Sep 7 17:10:08:765 2007 Sysname SSM/7/VOICE: SSM_PRIM [SUB_SLC]: Receive UCM Subscribe request message. // The SLC module received the subscription request from the UCM module. *Sep 7 17:10:08:765 2007 Sysname SSM/7/VOICE: SSM_INFO [SUB_SLC]: General: Succeed in getting a free element from the list. Additional: Subscirbe control block ID is 0.
SSM_INFO [SUB_SSA]: General: Succeed in getting a free element from the list. Additional: Subscribe control block ID is 1. // The SSA module got a free element from the list. *Sep 7 17:10:09:373 2007 Sysname SSM/7/VOICE: SSM_INFO [SUB_SSA]: General: Succeed in sending the network message. Additional: Method type is REFER. // The SSA module sent a REFER message to the network side. *Sep 7 17:10:09:473 2007 Sysname SSM/7/VOICE: SSM_INFO [SUB_SSA]: General: Received message from the stack.
SSM_INFO [SUB_SSA]: General: Succeed in sending the network message. Additional: Method type is REFER, status code is 202. *Sep 7 17:10:10:983 2007 Sysname SSM/7/VOICE: SSM_INFO [SUB_SSA]: General: Received message from the stack. Additional: The message type is NotifyInd. *Sep 7 17:10:11:83 2007 Sysname SSM/7/VOICE: SSM_PRIM [SUB_SSA]: Send UCM Subscribe request message. *Sep 7 17:10:11:233 2007 Sysname SSM/7/VOICE: SSM_PRIM [SUB_SLC]: Receive UCM Subscribe request message.
*Sep 7 17:10:12:394 2007 Sysname SSM/7/VOICE: SSM_EVENT [SUB_SLC]: SUBSCRIBE: Received event SUBREQUESTRSP while at state ACTIVE.(ObjectID = 0) *Sep 7 17:10:12:494 2007 Sysname SSM/7/VOICE: SSM_PRIM [SUB_SLC]: Send UCM Subscribe response message. *Sep 7 17:10:12:643 2007 Sysname SSM/7/VOICE: SSM_PRIM [SUB_SSA]: Receive UCM Subscribe response message. // The SSA module received a response to the subscription request from the UCM module.
SSM_INFO [SUB_SSA]: General: Succeed in sending the network message. Additional: Method type is NOTIFY. *Sep 7 17:10:17:739 2007 Sysname SSM/7/VOICE: SSM_INFO [SUB_SSA]: General: Received message from the stack. Additional: The message type is NotifyCfm. *Sep 7 17:10:17:935 2007 Sysname SSM/7/VOICE: SSM_PRIM [SUB_SSA]: Send UCM Subscribe response message. *Sep 7 17:10:18:35 2007 Sysname SSM/7/VOICE: SSM_PRIM [SUB_SLC]: Receive UCM Subscribe response message.
*Sep 7 17:10:19:195 2007 Sysname SSM/7/VOICE: SSM_INFO [SUB_SSA]: General: Succeed in sending the network message. Additional: Method type is NOTIFY, status code is 200. *Sep 7 17:10:19:345 2007 Sysname SSM/7/VOICE: SSM_PRIM [SUB_SSA]: Receive UCM Subscribe release message. // The SSA module received an unsubscription message from the UCM module. *Sep 7 17:10:19:495 2007 Sysname SSM/7/VOICE: SSM_INFO [SUB_SSA]: General: Succeed in sending the network message. Additional: Method type is SUBRELEASE.
Views User view Default command level 2: System level Parameters ucm: Enables debugging for SIP server call management. all: Specifies all types of debugging. error: Specifies error debugging. info: Specifies information debugging. Examples # Enable all types of debugging for SIP server call management.
Parameters srtp: Enables debugging for SRTP messages. all: Specifies debugging for all SRTP message types. error: Specifies debugging for error messages. event: Specifies debugging for event messages. Examples # Enable debugging for SRTP event messages. When a call is established by using SRTP, output similar to the following example is generated: *Apr 10 09:36:53:924 2010 H3C_Down SRTP/7/VOICE: SRTP_EVENT: Derive the session key whith AES_ICM algorithm.
Smart Link debugging commands The output description tables in this document only contain fields and messages that require an explanation. The Smart Link module name is identified as "SMLK" in debugging messages. debugging smart-link Use debugging smart-link to enable debugging for the specified or all smart link groups. Use undo debugging smart-link to disable debugging for the specified or all smart link groups.
Field Description Failed to write packet queue Writing packet queue failed. Failed to write packet event Writing packet event failed. Table 2 describes output fields and messages for the debugging smart-link packet command. Table 196 Output from the debugging smart-link packet command Field Description Port Port Name : String A Flush packet was sent or received on the port identified by Port Name.
Smart link group 1 : PSS occur event: Enter PSS state machine. *May 15 15:58:13:602 2007 Sysname SMLK/7/SMLKFSM: Smart link group 1 : PSS occur event: Member number is 1. *May 15 15:58:13:611 2007 Sysname SMLK/7/SMLKFSM: Smart link group 1 Port Ethernet1/1: PSS occur event: Link status is up. *May 15 15:58:13:622 2007 Sysname SMLK/7/SMLKFSM: Smart link group 1 Port Ethernet1/1: PST occur event: Enter PST state machine.
00 00 00 00 00 00 00 00 00 00 00 00 00 00 00 00 00 00 00 00 00 00 00 00 00 00 00 00 00 00 00 00 00 00 00 00 00 00 00 00 00 00 00 00 00 00 00 00 00 00 00 00 00 00 00 00 00 00 00 00 00 00 00 00 00 00 00 00 00 00 00 00 00 00 00 00 00 00 00 00 00 00 00 00 00 00 00 00 00 00 00 00 00 00 00 00 00 00 00 00 00 00 00 00 00 00 00 00 00 00 00 00 00 00 00 00 00 00 00 00 00 00 00 00 00 00 00 00 00 00 00 00 00 00 00 00 00 00 00 00 00 00 00 00 00 00 00 00 00 00 00 00 00 00 00 00 00 00 00 00 390
SNMP debugging commands The output description tables in this document only contain fields and messages that require an explanation. debugging snmp agent packet Use debugging snmp agent packet to enable SNMP packet debugging for the SNMP agent. Use undo debugging snmp agent packet to disable SNMP packet debugging for the SNMP agent. Syntax debugging snmp agent packet { header | receive | send } undo debugging snmp agent packet { header | receive | send } Default SNMP packet debugging is disabled.
Field Description SNMPv3 security level: • noAuthNoPriv—No authentication, no privacy. • authNoPriv—Authentication without privacy. • authPriv—Authentication with privacy. security level: security-level user name: user-name SNMPv3 username. snmpEngineID: engineID SNMP engine ID. snmpEngineBoots: n Number of SNMP engine reboots. snmpEngineTime: n SNMP engine running time in seconds. Table 2 describes output fields and messages for the debugging snmp agent packet receive command.
Field Description request-id: request-id ID of the SNMP response, used to match the SNMP request. error-status: error-status Error status of the SNMP response. error-index: error-index Error index of the SNMP response. VBLIST Variable binding list. response SNMP response. Examples # Enable information center debugging and SNMP packet header debugging on the device.
terminal monitor % Current terminal monitor is on debugging snmp agent packet header *Jul 27 08:51:00:563 2007 Sysname SNMP/7/HEADER: incoming SNMPv3 packet security model: v3 security level: authNoPriv user name: v3user1 snmpEngineID: 000063A27F00000100001707 snmpEngineBoots: 1 snmpEngineTime: 54591 // SNMP received an SNMPv3 request. # Enable information center debugging and received SNMP packet debugging on the device.
error-index: 0 *Jul 27 09:08:21:563 2007 Sysname SNMP/7/VBLIST: sysUpTime.0: 5563114 *Jul 27 09:08:21:563 2007 Sysname SNMP/7/PACKET_DES: packet sent to 10.165.81.75 via UDP // SNMP sent an SNMP response to 10.165.81.75 through UDP. debugging snmp agent process Use debugging snmp agent process to enable debugging for SNMP packet processing. Use undo debugging snmp agent process to disable debugging for SNMP packet processing.
Field Description DECODE_WARNING Warning-level debugging information generated during the SNMP request decoding process. DECODE_ERROR Error-level debugging information generated during the SNMP request decoding process. Table 5 describes output fields and messages for the debugging snmp agent process txrx command. Table 201 Output from the debugging snmp agent process txrx command Field Description TXRX_INFO Info-level debugging information generated when SNMP messages were being sent and received.
• SNMPv2c is enabled. • A community name is configured. terminal debugging % Current terminal debugging is on terminal monitor % Current terminal monitor is on debugging snmp agent process stack info *Jul 27 09:42:13:578 2007 Sysname SNMP/7/STACK_INFO: read request *Jul 27 09:42:13:578 2007 Sysname SNMP/7/STACK_INFO: PDU type is 160 and PDU version is 1.
Default Debugging for SNMP trap messages is disabled. Views User view Default command level 1: Monitor level Usage guidelines Table 7 describes output fields and messages for the debugging snmp trap packet command. Table 203 Output from the debugging snmp trap packet command Field Description TRAP_PACKET Trap message debugging information. The system sent the trap-name trap message to address. trap-name trap send to: address • trap-name—Name of the trap message.
send OK *Jul 27 10:10:35:297 2007 Sysname SNMP/7/VBLIST: sysUpTime.0: 5936387 *Jul 27 10:10:35:297 2007 Sysname SNMP/7/VBLIST: snmpTrapOID.0: 1.3.6.1.6.3.1.1.5.2 // The device sent the version 2 trap message to the destination host 10.165.81.75. The trap message was sent successfully, and the values of the binding variables sysUpTime.0 and snmpTrapOID.0 are 5936387 and 1.3.6.1.6.3.1.1.5.2, respectively debugging snmp trap process Use debugging snmp trap process to enable debugging for the SNMP trap task.
Field filter address address for sending trap-name Description Trap messages whose destination address is address are filtered when trap messages are being sent. • trap-name—Name of the trap node. • address—Destination IP address of trap messages. Examples # Enable information center debugging and SNMP trap module debugging on the device enabled with the SNMP trap sending function.
search entries in snmpTargetParamsTable to match snmpTargetAddrParams traphost.uu.10.165.81.
Spanning tree debugging commands The output description tables in this document only contain fields and messages that require an explanation. debugging stp all Use debugging stp all to enable all types of STP debugging. Use undo debugging stp all to disable all types of STP debugging. Syntax debugging stp all undo debugging stp all Default All types of STP debugging are disabled. Views User view Default command level 2: System level Examples # Enable all types of STP debugging.
Usage guidelines Table 1 describes output fields and messages for the debugging stp event command. Table 205 Output from the debugging stp event command Field Description A String event occurred on port PortID. The possible values of the String argument are: Port PortID occurs String event • • • • • • ADD VLAN—The port was assigned to a VLAN. DEL VLAN—The port was removed from a VLAN. SPEED CHANGE—The port speed changed. DUPLEX CHANGE—The duplex mode of the port changed.
interface interface-type interface-number: Specifies a port by its type and number. If you do not specify a port, this command enables STP FSM debugging for all ports. Usage guidelines Table 2 describes output fields and messages for the debugging stp fsm command. Table 206 Output from the debugging stp fsm command Field Description The state of port PortID(PortName) on MSTI InstanceID or VLAN VLANID is String.
Field Instance InstanceID's port PortID(PortName) is selected as String role VLAN VLANID's port PortID(PortName) is selected as String role Description The role of port PortID(PortName) on MSTI InstanceID or VLAN VLANID is String. The possible values of the String argument are: • • • • • DESIGNATED—The port is a designated port. ROOT—The port is a root port. ALTERNATE—The port is an alternate port. BACKUP—The port is a backup port. MASTER—The port is a master port.
Syntax debugging stp global-error undo debugging stp global-error Default STP global error debugging is disabled. Views User view Default command level 2: System level Usage guidelines Table 3 describes output fields and messages for the debugging stp global-error command. Table 207 Output from the debugging stp global-error command Field Description Port PortID(PortName) received BPDU packet is error for String Port PortID(PortName) received an error BPDU.
Field Description MSTP failed to write a queue. Write queue String error The possible values of the String argument are: • MstpMsgQue. • MstpPktQue. MSTP failed to write an event. Write event String error Bind vlan to instance InstanceID error The possible values of the String argument are: • MSTP_BPDU_EVENT. • MSTP_L2INF_EVENT. An error occurred when VLANs were bound to MSTI InstanceID. The state machine String of port PortID(PortName) on MSTI InstanceID or VLAN VLANID entered an unknown state.
Default command level 2: System level Usage guidelines Table 4 describes output fields and messages for the debugging stp global-event command. Table 208 Output from the debugging stp global-event command Field Description Instance InstanceID Enters PRS Machine MSTI InstanceID or VLAN VLANID entered the PRS state machine. VLAN VLANID Enters PRS Machine Examples # In MSTP mode, enable STP global event debugging.
Default command level 2: System level Parameters receive: Specifies debugging for received STP BPDUs. send: Specifies debugging for sent STP BPDUs. interface interface-type interface-number: Specifies a port by its type and number. If you do not specify a port, this command enables STP BPDU debugging for all ports. vlan vlan-id: Specifies a VLAN by its ID. The value range for the vlan-id argument varies with device models. If you do not specify a VLAN, this command enables STP BPDU debugging for all VLANs.
Field Description Port PortID(PortName) received a BPDU of type Type on VLAN VLANID and at length Number (in bytes). Port PortID(PortName) VLAN VLANID Rcvd Type Packet(Length:Number) The possible values of the Type argument are: • • • • Stp. Rstp. Mstp-dot1s. Mstp-legacy. ProtocolVersionID Protocol version ID. BPDUType BPDU type. CIST Root ID CIST root bridge ID. External RPC External root path cost. Reg Root ID Regional root bridge ID. Internal RPC Internal root path cost.
Internal RPC : 0 CIST Bridge ID : 32768.000f-e200-3700 CIST Port ID : 128.002 (Instance)Flags : (00)Desi[ A P ] // Ethernet 1/1 received a 103-byte MSTP legacy-format packet. # In MSTP mode, enable detailed STP BPDU debugging on all ports.
Views User view Default command level 2: System level Usage guidelines Table 6 describes output fields and messages for the debugging stp roles command.
Default command level 2: System level Parameters interface interface-type interface-number: Specifies a port by its type and number. If you do not specify a port, this command enables STP TC event debugging for all ports. Usage guidelines Table 7 describes output fields and messages for the debugging stp tc command. Table 211 Output from the debugging stp tc command Field Description TC event String occurred on port PortID(PortName).
SSH debugging commands The output description tables in this document only contain fields and messages that require an explanation. debugging ssh server Use debugging ssh server to enable SSH server debugging. Use undo debugging ssh server to disable SSH server debugging. Syntax debugging ssh server { all | vty vty-num { all | error | event | message } } undo debugging ssh server { all | vty vty-num { all | error | event | message } } Default SSH server debugging is disabled.
Field Description Service Auth Error: Identity authentication service request error. NewKey Error: Server newkey state machine error. GEX_Reply Error: GEX public key reply error. GEX_Group Error: Key exchange algorithm error. GRP Reply Error: GRP public key reply error. Server Key Init Error: Algorithm negotiation initialization error. SFTPS Opendir: SFTP server directory open error. SFTPS Open Error: File open error. SFTPS Process Error: SFTP server message process error.
Field Description STELS Start Shell: Start shell. Receive message: Received message from SFTP client. Successful to create task: Id=taskid The SSH module successfully created an SFTP task. SFTPS Message: SFTP message type. SFTP Server Init: SFTP version negotiation initialization. SFTPS Open: Opened file. SFTPS Close: Closed file. SFTPS Read: Read file. SFTPS Write: Written file. SFTPS Opendir: Opened directory. Readdir: Read directory. UserNameDazzle: Fake username.
debugging ssh server vty 1 event *Oct 12 09:32:58:462 2006 Sysname SSH/7/Server_EVENT: VTY[1]:Accept: Socket:6 LineIndex:83,IP:10.1.1.1 // The client Logged in from VTY 1, and the server created a socket. *Oct 12 09:32:58:463 2006 Sysname SSH/7/Server_EVENT: VTY[1]:Accept: SSH user comes from 10.1.1.1, and current FSM is SSH_Main_Connect // The TCP connection was established.
Receive Packet(len=268). *Oct 12 09:32:59:263 2006 Sysname SSH/7/Server_EVENT: VTY[1]:SUB1_FSM Change: From SSH_Sub1_KEX_GEX_Reply to SSH_Sub1_KEX_NewKey. // The SSH module updated the key. *Oct 12 09:32:59:507 2006 Sysname SSH/7/Server_EVENT: VTY[1]:Read: Process user [] from 10.1.1.1. *Oct 12 09:32:59:508 2006 Sysname SSH/7/Server_EVENT: VTY[1]:Read Buffer: Receive Packet(len=12).
*Oct 12 09:33:01:615 2006 Sysname SSH/7/Server_EVENT: VTY[1]:SUB2_Auth_FSM from SSH_Sub2_Auth_Password to SSH_Sub2_Auth_Init // Level-2 sub-state-machine returned to the authentication initialization status. *Oct 12 09:33:01:615 2006 Sysname SSH/7/Server_EVENT: VTY[1]:SUB1_FSM Change: From SSH_Sub1_Authentication to SSH_Sub1_Channel. // Channel request. *Oct 12 09:33:01:696 2006 Sysname SSH/7/Server_EVENT: VTY[1]:Read: Process user [client] from 10.1.1.1.
debugging ssh client { all | error | event | message } undo debugging ssh client { all | error | event | message } Default SSH client debugging is disabled. Views User view Default command level 1: Monitor level Parameters all: Specifies all types of SSH client debugging. error: Specifies SSH client error debugging. event: Specifies SSH client event debugging. message: Specifies SSH client message debugging.
Field Description NewKey: The client stayed in newkey state. GEX Init: GEX algorithm initialization. GEX Request: GEX request. Client_SendVersionString: The client sent version string. SFTPC: SFTP client. SFTPC CUSTOM CLOSED Client close message. Table 6 describes output fields and messages for the debugging ssh client error command. Table 217 Output from the debugging ssh client error command Field Description ProcessSession Error: Session processing error. Error: Error message.
KeyType:KEX_DH_GEX_SHA1 // The SSH module negotiated the key. *Oct 12 09:21:00:479 2006 Sysname SSH/7/Client_EVENT: FSM from SSH2_Main_KEX_Init to SSH2_Main_KEX_GEX_Request *Oct 12 09:21:00:889 2006 Sysname SSH/7/Client_EVENT: Read Buffer: Receive Packet(len=276). *Oct 12 09:21:00:889 2006 Sysname SSH/7/Client_EVENT: FSM from SSH2_Main_KEX_GEX_Request to SSH2_Main_KEX_GEX_Init // The SSH module performed GEX algorithm negotiation.
*Oct 12 09:21:10:141 2006 Sysname SSH/7/Client_EVENT: Read Buffer: Receive Packet(len=12). *Oct 12 09:21:10:142 2006 Sysname SSH/7/Client_EVENT: FSM from SSH2_Main_Shell to SSH2_Main_Session // The SSH module established a session.
SSL debugging commands debugging ssl Use debugging ssl to enable SSL debugging. Use undo debugging ssl to disable SSL debugging. Syntax debugging ssl { all | error | event | packet } undo debugging ssl { all | error | event | packet } Default SSL debugging is disabled. Views User view Default command level 1: Monitor level Parameters all: Specifies all types of SSL debugging. error: Specifies SSL error debugging. event: Specifies SSL event debugging. packet: Specifies SSL packet debugging.
Table 219 Output from the debugging ssl event command Field Description IN/OUT Inbound/outbound SSL protocol message. Information about the received or sent SSL 2.0 protocol message, including the length of the message (in hexadecimal) and the message type. Possible message types are: • CLIENT-HELLO. • CLIENT-MASTER-KEY. [ length length ], message-type • CLIENT-FINISHED. • SERVER-HELLO. • SERVER-VERIFY. • SERVER-FINISHED. • REQUEST-CERTIFICATE. • CLIENT-CERTIFICATE. • Unknown. SSL 2.
Field Description Information about the received or sent SSL 3.0 alert protocol message, including the length of the message (in hexadecimal), the error level, and the message description. The error level can be warning or fatal. Possible message descriptions are: • close_notify. • unexpected_message. • bad_record_mac. • decryption_failed. • record_overflow. • decompression_failure. • handshake_failure. • no_certificate. • bad_certificate.
Field Description SSLv2 read client string. SSLv2 read a client side message, which may be hello A, hello B, hello C, master key A, master key B, finished A, or finished B. SSLv2 write client string. SSLv2 wrote a client side message, which may be hello A, hello B, master key A, master key B, finished A, finished B, certificate A, certificate B, certificate C, or certificate D. SSLv2 write server string.
*Nov 9 17:06:19:147 2008 Sysname SSL/7/EVENT:SSL_accept start // SSL started the handshake process. *Nov 9 17:06:19:147 2008 Sysname SSL/7/EVENT:SSL_accept:before/accept initialization. // SSL was initializing the BEFORE/ACCEPT state. *Nov 9 17:06:19:150 2008 Sysname SSL/7/EVENT:IN: SSL 2.0 [length 004c], CLIENT-HELLO // SSL received a ClientHello handshake packet from the client. The protocol version is SSL 2.0 and the packet length is 76 bytes.
*Nov 9 17:06:19:156 2008 Sysname SSL/7/EVENT:OUT: SSL 3.0 Handshake [length 0004], ServerHelloDone // SSL sent a ServerHelloDone packet to the client. The protocol version is SSL 3.0 and the packet length is 4 bytes. *Nov 9 17:06:19:156 2008 Sysname SSL/7/EVENT:SSL_accept:SSLv3 write server done A. // SSLv3 wrote the ServerHelloDone packet that the server sent to the client. *Nov 9 17:06:19:156 2008 Sysname SSL/7/EVENT:SSL_accept:SSLv3 flush data. *Nov 9 17:06:19:406 2008 Sysname SSL/7/EVENT:IN: SSL 3.
// SSL was closing the SSL connection. The SSL ID is 24 and the socket ID is 3. *Nov 9 17:06:19:677 2008 Sysname SSL/7/EVENT:Write alert:Warning:close notify. // SSL wrote an alert packet. The alert level is warning and the description is close_notify. *Nov 9 17:06:19:678 2008 Sysname SSL/7/EVENT:OUT: SSL 3.0 Alert [length 0002], warning close_notify // SSL sent an alert packet to the client. The protocol version is SSL 3.
SSL VPN debugging commands debugging ssl-vpn Use debugging ssl-vpn to enable SSL VPN debugging. Use undo debugging ssl-vpn to disable SSL VPN debugging. Syntax debugging ssl-vpn { all | ipac | tlac | wac } { all | error | event | packet } undo debugging ssl-vpn { all | ipac | tlac | wac } { all | error | event | packet } Default SSL VPN debugging is disabled.
// A new connection was created. The IP address of the Web server is 192.168.1.100. *Jun 5 10:15:09:80 2008 Sysname SVPN/7/WAC_EVENT: Succeeded in putting connection to pool, site name is http:// 192.168.1.100/test/. // A connection was added. The website is http://192.168.1.100/test/. *Jun 5 10:15:09:95 2008 Sysname SVPN/7/WAC_EVENT: Deliver SSL connection to web server, connection ID: 327681. // The SSL connection was delivered to the Web server. The connection ID is 327681.
Stateful failover debugging commands The output description tables in this document only contain fields and messages that require an explanation. The stateful failover module name is identified as "DHBK" in debugging messages. debugging dhbk Use debugging dhbk state to enable stateful failover state debugging. Use undo debugging dhbk state to disable stateful failover state debugging.
Field Description LogID: logid Log ID. Version: version Version information included in Hello packets. Table 2 describes output fields and messages for the debugging dhbk state event command. Table 221 Output from the debugging dhbk state event command Field Description Action: Update DHBK state, current state: curr-state; next state: next-state. The hot backup state was updated. Send Hello packet too frequently, ignore it.
debugging dhbk service Use debugging dhbk service to enable stateful failover service debugging. Use undo debugging dhbk service to disable stateful failover service debugging. Syntax debugging dhbk service { all | error | event | fsm | info } undo debugging dhbk service { all | error | event | fsm | info } Default Stateful failover service debugging is disabled. Views User view Parameters all: Specifies all types of stateful failover service debugging.
Field Description Restored objects: Restore objects: restore-object • • • • • Common session. • • • • ALG attached information. Father session. Force session. Session relation-table. NAT attached information. The attached information will be backed up as the appended data of the session backup data) Blacklist. Aging message. LB session. Table 5 describes output fields and messages for the debugging dhbk service error command.
Field Description DHBK failed to get virtual service during LB data restoration: LB restore: Failed to get virtual service. (VPN ID: VPN-ID, IP: IP-address, Port: Port, Protocol: Protocol) • • • • VPN-ID—VPN ID. IP-address—IP address of the virtual service. Port—Port number of the virtual service. Protocol—Protocol type of the virtual service. DHBK failed to find valid MBUF during LB data backup because of insufficient memory. LB backup: MBuffer insufficient.
Table 226 Output from the debugging dhbk service info command Field Description NAT attached information: NAT attached information: • Local IP/Port—Private IP address and port number. • Global IP/Port—Public IP address and port number. • PatType—PAT type, including PAT, NOPAT, STATIC Local IP/Port: Local-IP/Port Global IP/Port: Global-IP/Port (one-to-one NAT), and SERVER (NAT internal server). PatType: PatType VPN: VPN • VPN—VPN index.
Field Description LB backup information. L4 LB session backup succeeded. • VPN-ID—VPN ID. • Virtual Service—Virtual service information: L4 LB session backed up. VPN ID: VPN-ID, Virtual Service (IP: IP-address, Port: Port), SNat (IP: IP-address, Port: Port), Real Service (IP: IP-address, Port: Port, Name: rservicename), Client (IP: IP-address, Port: Port) IP-address—IP address of the virtual service. Port—Port number of the virtual service.
Field Description LB restoration information. L7 LB session restored: • Redirect-info—Redirection identifier. • Seqnum-adjust—Sequence number adjustment L7 LB session restored. Redirect: Redirect-info, Seq num adjust: Seqnum-adjust, MSS: MSS-info, Request Sequence Info (Init: init-info, Adjust len: adjust-len, Next Adjust len: nextadjust-len), Response Sequence Info (Init: init-info, Adjust len: adjust-len, Next Adjust len: nextadjust-len). identifier. • MSS-info—MSS information.
// A session between 10.1.1.11 and 100.0.0.100 was established. TCP is used for communication. *Apr 26 12:46:20:464 2000 Sysname DPNAT/7/debug: dhbk service info: NAT attached information: Local IP/Port: 10.1.1.11/0 Global IP/Port: 100.0.0.50/0 PatType: STATIC VPN: 0 // The IP address and port number 10.1.1.11 and 0 were translated into 100.0.0.50 and 0, respectively by using static NAT.
Terminal access debugging commands The output description tables in this document only contain fields and messages that require an explanation. debugging rta error Use debugging rta error to enable terminal access error debugging. Use undo debugging rta error to disable terminal access error debugging. Syntax debugging rta error undo debugging rta error Default Terminal access error debugging is disabled.
Examples # Enable terminal monitoring and terminal access error debugging. Output similar to the following example is generated when you enter VTY 0 view under the following conditions: • VTY 0 of telnet type is configured in terminal template view. • A non-existent IP address is configured for the peer end. • The template is applied to an interface and the terminal number is set to 1.
Field Description Terminal n set the current state to MENU. A terminal can be in one of the following states: • DELETE—The terminal is deleted. • DOWN—The terminal is configured but the link is down. Terminal[n] set state to MENU! • UP—The terminal is configured and the link is up. • AAA—Authentication state. • OK—The authentication is passed and the connection can be established. • Menu—Menu state. APP[m] initialize ETelnet taskdata successfully. ARP m initialized ETelnet control block successfully.
Views User view Default command level 1: Monitor level Parameters brief: Specifies brief terminal access packet information debugging. detail: Specifies detailed terminal access packet information debugging. all: Specifies all types of terminal access packet debugging. recv-remote: Displays information about terminal access packets received from the peer end. recv-terminal: Displays information about terminal access packets received from the terminal.
• A link to a FEP is established. terminal monitor terminal debugging debugging rta packet detail recv-terminal 1 *Nov 25 19:25:57:712 2006 Sysname RTA/7/debug: 19:25:57 Terminal[1]: Receive from terminal 1 bytes: *Nov 25 19:25:57:713 2006 Sysname RTA/7/debug: ----------------------------------------------000: 0d // Terminal access received one byte of data (0d) from the terminal.
Track debugging commands The output description tables in this document only contain fields and messages that require an explanation. debugging track Use debugging track to enable Track debugging. Use undo debugging track to disable Track debugging. Syntax debugging track undo debugging track Default Track debugging is disabled. Views User view Default command level 1: Monitor level Usage guidelines Table 1 describes the output fields and messages for the debugging track command.
• Field • Description • timestamp indicates the time when the message was sent, in the format of hh:mm:ss:sss, for example, 10:12:21:708. • hh is in the range of 00 to 23, mm and ss are in the range of 00 to 59, and sss is in the range of 0 to 999. • Send the information of track entry entry-number to all IO slots, Track Status: track-status, Message Type: message-type, Send Time: timestamp. • track-status values: • Positive. • Invalid. • Negative. • message-type values: • 1—Creates a track object.
[Sysname-nqa-admin-test-icmp-echo] frequency 5000 [Sysname-nqa-admin-test-icmp-echo] reaction 1 checked-element probe-fail threshold-type consecutive 5 action-type trigger-only *Apr 30 18:58:56:520 2007 Sysname TRACK/7/TRACK Debug: Receive the notification that NQA(admin-test) reaction(1) is created. // Track received a notification that NQA (admin-test) Reaction entry 1 had been created. # Create a track entry.
Tunneling debugging commands The output description tables in this document only contain fields and messages that require an explanation. debugging ipv4-tunnel Use debugging ipv4-tunnel to enable IPv4 tunnel debugging. Use undo debugging ipv4-tunnel to disable IPv4 tunnel debugging. Syntax debugging ipv4-tunnel { all | error | packet } undo debugging ipv4-tunnel { all | error | packet } Default No IPv4 tunnel debugging is enabled.
Table 231 Output from the debugging ipv4-tunnel error command (on multi-core devices) Field Description Tunnel interface is down. Dropped the packet The packet was discarded because the tunnel is down. Table 3 describes the output fields and messages for the debugging ipv4-tunnel packet command (on single-core devices).
Field Description packet: Packet is sent to slot number A tunnel packet was sent to interface board number for decapsulation. Examples • On single-core devices: # Enable IPv4 tunnel error debugging on the local device. Output similar to the following example is generated when an IPv4 packet with an invalid source IP address (a loopback interface address, for example) arrives under the following conditions: • An IPv4 tunnel is established between two devices.
--- 5.5.5.2 ping statistics --1 packet(s) transmitted 1 packet(s) received 0.00% packet loss round-trip min/avg/max = 78/78/78 ms On multi-core devices: • # Enable IPv4 tunnel error debugging on the local device. The output in this example was created when the following conditions exist: • An IPv4 tunnel is established between two devices. • Parameters are configured to bring up only the peer tunnel interface.
debugging ipv6-tunnel Use debugging ipv6-tunnel to enable IPv6 tunnel debugging. Use undo debugging ipv6-tunnel to disable IPv6 tunnel debugging. Syntax debugging ipv6-tunnel { all | error | packet } undo debugging ipv6-tunnel { all | error | packet } Default No IPv6 tunnel debugging is enabled. Views User view Default command level 1: Monitor level Parameters all: Specifies all IPv6 tunnel debugging. error: Specifies IPv6 tunnel error debugging. packet: Specifies IPv6 tunnel packet debugging.
Table 235 Output from the debugging ipv6-tunnel error command (on multi-core devices) Field Description Failed to add IPv4 header IPv6 tunnel failed to add the IPv4 header to the IPv6 tunnel packet. Failed to add IPv6 header IPv6 tunnel failed to add the IPv6 header to the IPv6 tunnel packet. Failed to send packet to FC module IPv6 tunnel failed to classify the flow.
// Before decapsulation at the tunnel interface Tunnel 2, the source and destination IP addresses in the packet header are 2003::0002 and 2003::0001, and the packet length is 144. *0.3760312 Sysname IPV6-TUN/8/debug: Tunnel2 packet: After decapsulation, Outgoing packet header 2005::0002->2005::0001(length = 104) // After encapsulation at the tunnel interface Tunnel 2, the source and destination IP addresses in the packet header are 2005::0002 and 2005::0001, and the packet length is 104.
// After encapsulation at the tunnel interface Tunnel 1, the source and destination IP addresses in the packet header are 2.1.1.1 and 2.1.1.2, and the packet length is 124. *Mar 6 13:08:34:890 2008 Sysname DP6IN4/7/debug: packet: Before decapsulation, packet header 2.1.1.2->2.1.1.1(length = 124). // Before decapsulation at the tunnel interface Tunnel 1, the source and destination IP addresses in the packet header are 2.1.1.2 and 2.1.1.1, and the packet length is 124.
debugging tunnel event *Jul 17 09:16:07:930 2008 Sysname TUNNEL/7/debug: Tunnel1 can't come up because: // The link state of Tunnel1 cannot be up, and the reason might be the following: *Jul 17 09:16:07:930 2008 Sysname TUNNEL/7/debug: Tunnel source is null. // The link state of Tunnel1 was down because the source IP address was not configured. *Jul 17 09:16:07:935 2008 Sysname TUNNEL/7/debug: Tunnel destination is null.
UDP helper debugging commands The output description tables in this document only contain fields and messages that require an explanation. debugging udp-helper Use debugging udp-helper to enable UDP helper debugging. Use undo debugging udp-helper to disable UDP helper debugging. Syntax debugging udp-helper { event | packet [ receive | send ] } undo debugging udp-helper { event | packet [ receive | send ] } Default UDP helper debugging is disabled.
Field Description Prompt: Send the packet to udp module in BOOTP and DHCP case. BOOTP or DHCP UDP packets were directly delivered to the UDP module. Self UNIT is MASTER UNIT Send bootp/dhcp RESPONSE packet to udp module Prompt: Self UNIT is SLAVE UNIT Send bootp/dhcp RESPONSE packet to MASTER UNIT : number The local unit was the active MPU, and BOOTP/DHCP responses were delivered to the UDP module. The local unit was a standby MPU, and BOOTP/DHCP responses were delivered to the active MPU.
Dest Ip(1.1.1.255) Source Ip(1.1.1.5) Dest Port(520) New Dest Ip(2.2.2.2) Prompt: Forward the packet to destination server // UDP helper sent the UDP packet to the server at 2.2.2.2.
URPF debugging commands The output description tables in this document only contain fields and messages that require an explanation. debugging ip urpf discards Use debugging ip urpf discards to enable URPF debugging. Use undo debugging ip urpf discards to disable URPF debugging. Syntax debugging ip urpf discards [ interface interface-type interface-number ] undo debugging ip urpf discards [ interface interface-type interface-number ] Default URPF debugging is disabled.
VLAN termination debugging commands The VLAN termination module name is identified as "SIFVLAN" in debugging messages. The output description tables in this document only contain fields and messages that require an explanation. debugging vlan Use debugging vlan to enable VLAN termination debugging. Use undo debugging vlan to disable VLAN termination debugging.
Table 239 Output from the debugging vlan command Field Description SIFVLAN created subinterface interface-name by calling the create function on the drive. The subinterface state changed from state1 to state2. The VID argument indicates the VID of the interface. interface-name: state1 to state2, DRV create interface, the Vid is VID • interface-name specifies the subinterface name, for example, Ethernet 1/1.0. • state1 and state2 refer to the subinterface states.
// SIFVLAN deleted the VLAN ID information configured for the subinterface and removed the subinterface by calling the destroy function on the drive. [Sysname-Ethernet1/1.1] vlan-type dot1q vid 1 second-dot1q 10 12 *Mar 26 17:07:25:156 2008 Sysname SIFVLAN/7/EVENT: Ethernet1/1.1: None to ambiguous qinq, DRV create interface, the Vid is 0x1 *Mar 26 17:07:25:156 2008 Sysname SIFVLAN/7/EVENT: Ethernet1/1.1: None to ambiguous qinq, enable qinq *Mar 26 17:07:25:156 2008 Sysname SIFVLAN/7/EVENT: Ethernet1/1.
// SIFVLAN received an untagged 42-byte unicast packet on Ethernet 1/1.1.
VoFR debugging commands The output description tables in this document only contain fields and messages that require an explanation. debugging voice vofr Use debugging voice vofr to enable VoFR debugging. Use undo debugging voice vofr to disable VoFR debugging.
Table 240 Output from the debugging voice vofr error command Field Description invalid argument The input parameter is incorrect. status error A call status error. attach vofr id error! VoFR failed to register the VoFR ID with the VIM. call info table index error The call information table index was incorrect. not enough memory! VoFR failed to assign memory because the memory was insufficient. create vofr ccb error! VoFR failed to create a CCB. find ccb error! VoFR failed to find the CCB.
Field Description delete ccx error! VoFR failed to delete the CCX. vofr local call id is already exist! The local call ID already existed in the CCB. can not assign more vofr call id! VoFR failed to assign a local call ID. get call info tab error! VoFR failed to obtain a call information table index. get switch mode error! VoFR failed to obtain a switching mode. clear fax data in vofr ccb error! VoFR failed to clear fax data in VoFR CCB.
Field Description VOFR_STANDARD_SWITCH: The VOFR_SETUP message was sent successfully. send VOFR_SETUP successfully! VOFR_STANDARD_SWITCH: The VOFR_CALL_PROCEEDING message was sent successfully. send VOFR_CALL_PROCEEDING successfully! VOFR_STANDARD_SWITCH: The VOFR_ALERTING message was sent successfully. send VOFR_ALERTING successfully! VOFR_STANDARD_SWITCH: The VOFR_CONNECT message was sent successfully.
Field Description delete vofr address information in entity entity index The VoFR address information in VoFR voice entity entity index was deleted. This operation was triggered by deletion of a serial interface. Receive Vim VIEVT_COM_FAXTONE_STOP_IND Message! The stop-sending-fax-tone event was received from the VIM. recvive vim fax tone VI_FAX_TONE_CNG! The fax calling tone (CNG) was received from the VIM. receive vim fax tone VI_FAX_TONE_CED! The fax answer tone (CED) was received from the VIM.
Table 245 Output from the debugging voice vofr fax packet to-net command Field Description voice_vofr_fax packet to net: The fax data sent to the network side was displayed. len = packet length, time = system time, status = fax status The packet length, current system time, status of the FAX module, and fax data sent to the network side were displayed sequentially. fax data to net Table 7 describes output fields and messages for the debugging voice vofr fsm command.
Table 247 Output from the debugging voice vofr info command Field Description VOFR_STANDARD_SWITCH: open channel successfully! In the Huawei-compatible mode, a media channel was opened successfully. fofr fax switch error! VoFR failed to switch to fax. The local call ID was registered with the VIM. attach vofrid interface: Interface type and interface number: interface vofrid: Local call id.
Field Description send VICTL_COM_EC_ON to dsp DSP was notified to enable the echo cancellation (EC) function. send VICTL_COM_EC_OFF to dsp DSP was notified to disable the EC function. send VICTL_COM_VAD_ON to dsp DSP was notified to enable VAD. send VICTL_COM_VAD_OFF to dsp DSP was notified to disable VAD. relay( Number of Fax Data)temporarily saved fax packets to fofr! Buffered fax packets were sent to the FOFR module for processing.
Field Description timer VF_FAXTONESENDBYVOICE_ID expire! The VF_FAXTONESENDBYVOICE_ID timer expired. timer VF_VOICETOFAX_ID expire! The VF_VOICETOFAX_ID timer expired. create timer timer name successfully! VoFR succeeded in creating a timer name. delete timer timer name VoFR succeeded in deleting a timer. Process timer name Out Processing the timer timed out. VOFR_T301B T301B timer with a time length of 240000 ms. VoFR waits for an ACCP_CONNECT message after the timer is started.
Examples # Enable debugging for VoFR errors on Router 1. Output similar to the following example is generated when Router 1 originates a call to Router 2 under the following conditions: • The Huawei-compatible protocol is configured as the call control protocol on Router 1. • The four codec types configured on Router 1 are different from those configured on Router 2.
// An ACCP_CHANNEL_READY message was sent to the CMC. *Sep 19 11:55:28:433 2006 Router1 VOFR/7/VOFR: voice_vofr_event: VOFR_STANDARD_SWITCH: ACCP_CHANNEL_READY_ACK message received! // An ACCP_CHANNEL_READY_ACK was received from the CMC. *Sep 19 11:55:32:899 2006 Router1 VOFR/7/VOFR: voice_vofr_event: VOFR_STANDARD_SWITCH: VOFR_CONNECT received! // A VOFR_CONNECT message was received from Router 2.
receive accp release complete from cmc! // An ACCP_RELEASE_COMPLETE message was received from the CMC. • Event debugging on Router 2: *Sep 19 11:52:08:932 2006 Router2 VOFR/7/VOFR: voice_vofr_event: VOFR_STANDARD_SWITCH: VOFR_SETUP received! // A VOFR_SETUP message was received from Router 1. *Sep 19 11:52:09:347 2006 Router2 VOFR/7/VOFR: voice_vofr_event: VOFR_STANDARD_SWITCH: send VOFR_CALL_PROCEEDING successfully! // A VOFR_CALL_PROCEEDING message was sent to Router 1.
VOFR_STANDARD_SWITCH: send ACCP_INFORMATION[RB STOP] ok! // An ACCP_INFORMATION message was sent to the CMC to stop playing ringback tones. *Sep 19 11:52:15:15 2006 Router2 VOFR/7/VOFR: voice_vofr_event: VOFR_STANDARD_SWITCH: send ACCP_INFORMATION[DTMF_ENABLE] successfully! // An ACCP_INFORMATION message was sent to the CMC to enable out-of-band DTMF detection.
debugging voice vofr fax packet from-dp voice_vofr_fax packet from dp: len = 42, time = 1367830, status = FAX_PC_WaitPstnData 00 09 00 00 E4 5F B8 3D B7 FB 30 02 7D ED 00 09 00 00 43 C2 34 8E BC 71 D7 85 17 ED 00 09 00 00 F6 BC 30 0E 23 90 06 DD 1D ED // Fax data was received from voice interfaces. • The data length was 42 bytes. • The system time was 1367830. • The fax module was in the FAX_PC_WaitPstnData state.
LocalCallID: 1 CurrentStatus: S_M_CALLPROC, PastStatus: S_M_SETUP // The call state of the local CCB changed from S_M_SETUP to S_M_CALLPROC, and the local call ID of the CCB was 1. *Sep 19 11:55:27:818 2006 Router1 VOFR/7/VOFR: voice_vofr_fsm: VOFR_STANDARD_SWITCH: call status changed! LocalCallID: 1, CurrentStatus: S_M_ALERTING, PastStatus: S_M_CALLPROC // The call state of the local CCB changed from S_M_CALLPROC to S_M_ALERTING, and the local call ID of the CCB was 1.
LocalCallID: 1, CurrentStatus: S_B_CONNECT, PastStatus: S_B_ALERTING // The call state of the local CCB changed from S_B_ALERTING to S_B_CONNECT, and the local call ID of the CCB was 1. *Sep 19 15:06:22:813 2006 Router2 VOFR/7/VOFR: voice_vofr_fsm: VOFR_MODE_VOICE -> VOFR_MODE_SWITCH_RTFAX // The state of Router 2 changed from Voice to SWITCH_RTFAX. # Enable debugging for VoFR information on Router 1 and Router 2.
voice_vofr_info: limit rate unchanged! // The current fax rate was allowed, so it was unnecessary to change the fax rate. *Sep 19 15:09:56:265 2006 Router1 VOFR/7/VOFR: voice_vofr_info: send last Modulation-Off to net // A modulation-off signal was sent to the network side. *Sep 19 15:11:20:554 2006 Router1 VOFR/7/VOFR: voice_vofr_info: send VICTL_COM_RTFAX_OFF to dsp! // A signal to the DSP was sent to stop a fax instance.
// The codec capability set was received from Router 1: The g729r8 codec was 67. The g711alaw codec was 8. The g711ulaw codec was 9. The g723r53 codec was 201. *Sep 19 11:52:08:933 2006 Router2 VOFR/7/VOFR: voice_vofr_info: seq = 0, timestamp = 0, vad = 0 // seq = 0 means the voice packet carries no sequence number, timestamp = 0 means the voice packet carries no timestamp, and vad = 0 means VAD is disabled.
// Ringback tones were successfully stopped. *Sep 19 15:06:36:673 2006 Router2 VOFR/7/VOFR: voice_vofr_info: receive preamble from net! moduration type = 4 // A preamble was received from the network side. The modulation type of fax data was V29_7200. *Sep 19 15:06:38:385 2006 Router2 VOFR/7/VOFR: voice_vofr_info: get modulation-off again! // A modulation-off signal was received.
*Sep 19 11:55:26:816 2006 Router1 VOFR/7/VOFR: voice_vofr_timer: VOFR_STANDARD_SWITCH: create timer T303M successfully! // The timer T303M was created. *Sep 19 11:55:26:817 2006 Router1 VOFR/7/VOFR: voice_vofr_timer: VOFR_STANDARD_SWITCH: delete timer T303M. // The timer T303M was deleted. *Sep 19 11:55:27:12 2006 Router1 VOFR/7/VOFR: voice_vofr_timer: VOFR_STANDARD_SWITCH: create timer T310M successfully! // The timer T310M was created.
VOFR_STANDARD_SWITCH: delete timer T303B! // The timer T303B was deleted. *Sep 19 11:52:11:372 2006 Router2 VOFR/7/VOFR: voice_vofr_timer: VOFR_STANDARD_SWITCH: create timer T301B successfully! // The timer T301B was created. *Sep 19 11:52:15:14 2006 Router2 VOFR/7/VOFR: voice_vofr_timer: VOFR_STANDARD_SWITCH: delete timer T301B! // The timer T301B was deleted. *Sep 19 15:06:22:813 2006 Router2 VOFR/7/VOFR: voice_vofr_timer: switch timer started! // The switch timer was started.
Voice subscriber line debugging commands The output description tables in this document only contain fields and messages that require an explanation. debugging voice cmc Use debugging voice cmc to enable Call Management Center (CMC) debugging. Use undo debugging voice cmc to disable CMC debugging. Syntax debugging voice cmc { all | error | event | fsm | info | timer } undo debugging voice cmc { all | error | event | fsm | info | timer } Default CMC debugging is disabled.
• The call ID is invalid. • The called address is 400, and the caller address is 100. • The session source index is 0x2c0030. • The call information table index is 0x0. • Q931 transparent transmission is invalid. *Nov 26 09:48:36:343 2006 Sysname CMC/7/VOICE: CMC -->LGS : ACCP_SETUP_ACK CallID = 0xc0000 LocalID = 0xf *Nov 26 09:48:36:344 2006 Sysname CMC/7/VOICE: CMC -->H323 : ACCP_SETUP CallID = 0xc0001 LocalID = 0xffffffff CalledAddr......400 CallerAddr......100 Source IpAddr...0.0.0.
• The call information table index is 0x0. • Q931 transparent transmission is valid. *Nov 26 09:48:43:13 2006 Sysname CMC/7/VOICE: H323-->CMC : ACCP_INFORMATION CallID = 0xc0001 LocalID = 0xb OubBand Dtmf....Disable DTMF Character..Invalid EchoCancel IE...Invalid RingBack IE.....Invalid HookFlash Evt...Invalid NTE IE.....Invalid // H.323 sent an ACCP_INFORMATION message to CMC. • Out-of-band DTMF is disabled. • DTMF characters are invalid. • Echo cancellation is invalid.
// LGS sent an ACCP_CHANNEL_READY to CMC. The codec is G711A. VAD is disabled. *Nov 26 09:48:43:16 2006 Sysname CMC/7/VOICE: CMC -->LGS : ACCP_CHANNEL_READY_ACK CallID = 0xc0000 LocalID = 0xf Media Connect...Success // LGS received an ACCP_CHANNEL_READY_ACK message from CMC. The media connection was established. *Nov 26 09:48:43:24 2006 Sysname CMC/7/VOICE: H323-->CMC : ACCP_CHANNEL_READY CallID = 0xc0001 LocalID = 0xb DecodeProtocol..G729R8 EncodeProtocol..G729R8 Vad Switch......
ReleaseCause....Normal clearing! Q931Info........Valid // After CMC received an ACCP_RELEASE message from H.323, CMC sent an ACCP_RELEASE message to LGS. The reason is a normal disconnection. Q931 transparent transmission is valid. *Nov 26 09:48:56:156 2006 Sysname CMC/7/VOICE: LGS -->CMC : ACCP_RELEASE_COMPLETE CallID = 0xc0000 LocalID = 0xf // CMC received an ACCP_RELEASE_COMPLETE message from LGS. # Enable CMC FSM debugging.
CMC_INFO: Connect state has already been active in connecting media. *May 9 10:01:37:627 2007 Sysname CMC/7/VOICE: CMC_INFO: The brother leg media state is active. *May 9 10:01:37:635 2007 Sysname CMC/7/VOICE: CMC_INFO: Successful to connecting media. // The media was successfully connected. *May 9 10:15:28:266 2007 Sysname CMC/7/VOICE: CMC_INFO: Successful to disconnecting media. // The media was successfully disconnected after the caller hung up.
*Nov 26 09:52:26:868 2006 Sysname CMC/7/VOICE: CMC_TMR:CallId[e0000] Delete Call Timer TimerId : 272 *Nov 26 09:52:26:868 2006 Sysname CMC/7/VOICE: CMC_TMR:CallId[e0000] Create TIMER_INLEG_WAIT_CONNECT Timer TimerId : 676 TimerLength : 120000 ms *Nov 26 09:52:32:33 2006 Sysname CMC/7/VOICE: CMC_TMR:CallId[e0001] Delete Call Timer TimerId : 911 *Nov 26 09:52:32:34 2006 Sysname CMC/7/VOICE: CMC_TMR:CallId[e0000] Delete Call Timer TimerId : 676 *Nov 26 09:52:32:43 2006 Sysname CMC/7/VOICE: CMC_TMR:Ca
Default command level 2: System level Parameters all: All types of E&M debugging. error: E&M error debugging. event: E&M event debugging. fsm: E&M FSM debugging. timer: E&M timer debugging. Examples # Enable E&M error debugging. When the cable is disconnected, output similar to the following example is generated: debug voice em error Enable EM ERROR message debugging functions *Apr 12 17:51:13:430 2007 Sysname EM/7/VOICE: EM_ERROR : Failed to get ViIfIndex.
*Aug 2 07:17:52:234 2006 Sysname EM/7/VOICE: EM_EVENT [5/0:0.0]: Succeed in sending AccpSetupAck to CMC. // E&M sent AccpSetupAck to CMC. *Aug 2 07:17:52:234 2006 Sysname EM/7/VOICE: EM_EVENT [5/0:0.0]: Succeed in sending seize digital line signal:0101. // E&M sent a seize digital line signal. *Aug 2 07:17:52:234 2006 Sysname EM/7/VOICE: EM_EVENT [5/0:0.0]: Succeed in sending AccpAlerting to CMC. // E&M sent AccpAlerting to CMC. *Aug 2 07:17:52:435 2006 Sysname EM/7/VOICE: EM_EVENT [5/1:0.
// E&M received DTMF digit 0. *Aug 2 07:17:54:68 2006 Sysname EM/7/VOICE: EM_EVENT [5/1:0.0]: Received phone number 10 partly matched! // Two DTMF digits (10) were matched. *Aug 2 07:17:54:78 2006 Sysname EM/7/VOICE: EM_EVENT [5/1:0.0]: Received VIM_DTMF_IND from VIM on state EMCALLED_RECEIVING_NUMBER. // E&M received a DTMF digit from VIM in state EMCALLED_RECEIVING_NUMBER. *Aug 2 07:17:54:279 2006 Sysname EM/7/VOICE: EM_EVENT [5/1:0.0]: Received DTMF 0. // E&M received DTMF digit 0.
*Aug 2 07:18:01:309 2006 Sysname EM/7/VOICE: EM_EVENT [5/1:0.0]: Received ACCP_CONNECT from CMC on state EMCALLED_RINGING. // E&M received ACCP_CONNECT from CMC in state EMCALLED_RINGING. *Aug 2 07:18:01:309 2006 Sysname EM/7/VOICE: EM_EVENT [5/1:0.0]: Succeed in stopping ringing. // E&M stopped ringing. *Aug 2 07:18:01:309 2006 Sysname EM/7/VOICE: EM_EVENT [5/1:0.0]: Succeed in sending seize digital line signal:0101. // E&M sent a seize digital line signal.
EM_EVENT [5/0:0.0]: Received ACCP_RELEASE_COMPLETE from CMC on state EMCALLER_CALLER_ONHOOK. // E&M received ACCP_RELEASE_COMPLETE from CMC in state EMCALLER_CALLER_ONHOOK. *Aug 2 07:18:06:445 2006 Sysname EM/7/VOICE: EM_EVENT [5/0:0.0]: Succeed in sending idle digital line signal:1101. // E&M sent an idle digital line signal. *Aug 2 07:18:06:445 2006 Sysname EM/7/VOICE: EM_EVENT [5/0:0.0]: Succeed in sending uninstall to Driver to CMC. // E&M uninstalled DSP resources.
*Aug 2 09:12:18:240 2006 Sysname EM/7/VOICE: EM_FSM [5/1:0.0]: State changed from EMCALLED_WAIT_RECEIVE_NUMBER to EMCALLED_RECEIVING_NUMBER. // The callee state changed EMCALLED_RECEIVING_NUMBER. *Aug from EMCALLED_WAIT_RECEIVE_NUMBER to 2 09:12:18:445 2006 Sysname EM/7/VOICE: EM_FSM [5/0:0.0]: State changed from EMCALLER_WAIT_SEND_NUMBER to EMCALLER_SENDING_NUMBER. // The caller state EMCALLER_SENDING_NUMBER.
EM_TIMER [5/0:0.0]: Created signal_wait TimerId [417] which will last 300ms waiting for sending phone number. // E&M created the signal_wait timer [417] that will wait 300 ms before sending the called number. *Aug 2 11:47:16:657 2006 Sysname EM/7/VOICE: EM_TIMER[5/1:0.0]: Deleted TimerId [417]. // E&M deleted the timer [417]. *Aug 2 11:47:31:367 2006 Sysname EM/7/VOICE: EM_TIMER [5/0:0.0]: Created signal_confirm TimerId [392] which will last 50ms waiting for confirming the idle signal.
Syntax debugging voice lgs { all | error | event | fsm | timer } undo debugging voice lgs { all | error | event | fsm | timer } Default LGS debugging is disabled. Views User view Default command level 2: System level Parameters all: All types of LGS debugging. error: LGS error debugging. event: LGS event debugging. fsm: LGS FSM debugging. timer: LGS timer debugging. Examples # Enable LGS error debugging.
LGS_EVENT:[2883633] Send VI Install Command To Driver // LGS sent the VI Install command to the driver. *Jul 1 12:46:24:961 2006 Sysname LGS/7/VOICE: LGS_EVENT:[2883633] Rcv VIM Message: VIEVT_COM_INSTALL_ACK: Success // LGS received VIM message VIEVT_COM_INSTALL_ACK. *Jul 1 12:46:24:962 2006 Sysname LGS/7/VOICE: LGS_EVENT:[2883633] Found CCB for VIM Message VIEVT_COM_INSTALL_ACK, State:FXS_CALLER_INSTALLING // LGS found CCB for VIM Message VIEVT_COM_INSTALL_ACK in state FXS_CALLER_INSTALLING.
Q931Info........Invalid // LGS sent ACCP_SETUP to CMC. *Jul 1 12:46:34:762 2006 Sysname LGS/7/VOICE: LGS_EVENT:[2883633] Send DTMF Detect Off Command To Driver. // LGS notified the driver to disable DTMF detection. *Jul 1 12:46:35:364 2006 Sysname CMC/7/VOICE: CMC -->LGS : ACCP_SETUP_ACK CallID = 0x20000 LocalID = 0x3 // CMC sent ACCP_SETUP_ACK to LGS. *Jul 1 12:46:35:364 2006 Sysname CMC/7/VOICE: CMC -->LGS : ACCP_SETUP CallID = 0x20001 LocalID = 0xffffffff CalledAddr......300 CallerAddr...
Target IfIndex..0x2c0030 InbandInfo......Invalid CallInfoTab.....0xffff Q931Info........Invalid // LGS sent ACCP_ALERTING to CMC. *Jul 1 12:46:37:803 2006 Sysname CMC/7/VOICE: CMC -->LGS : ACCP_ALERTING CallID = 0x20000 LocalID = 0x3 Target IfIndex..0x2c0030 InbandInfo......Invalid CallInfoTab.....0x0 Q931Info........Invalid // CMC sent ACCP_ALERTING to LGS. *Jul 1 12:46:38:04 2006 Sysname LGS/7/VOICE: LGS_EVENT:Inbandinfo unavail,play ringback on two second later.
LGS_EVENT:[2883632]MSG_ACCP_CHANNEL_READY message have send. *Jul 1 12:46:45:561 2006 Sysname CMC/7/VOICE: LGS -->CMC : ACCP_CONNECT CallID = 0x20001 LocalID = 0x4 Q931Info........Invalid // LGS sent ACCP_CONNECT to CMC. *Jul 1 12:46:45:562 2006 Sysname CMC/7/VOICE: CMC -->LGS : ACCP_CONNECT CallID = 0x20000 LocalID = 0x3 Q931Info........Invalid // CMC sent ACCP_CONNECT to LGS. *Jul 1 12:46:45:764 2006 Sysname LGS/7/VOICE: LGS_EVENT:[2883633] Send Stop SigTone Command To Driver.
*Jul 1 12:46:52:727 2006 Sysname LGS/7/VOICE: LGS_EVENT:[2883632] Delete CCB At State:LGS_RELEASING, Local Call Ref:4, CMC ID:131073 *Jul 1 12:46:52:929 2006 Sysname CMC/7/VOICE: CMC -->LGS : ACCP_RELEASE CallID = 0x20000 LocalID = 0x3 ReleaseCause....Normal onhook by user! Q931Info........Invalid // The caller released local resources upon receiving ACCP_RELEASE.
*Jul 1 12:46:24:962 2006 Sysname LGS/7/VOICE: LGS_TIMER:[2883633] Delete Timer Wait Install ACK Success, State:FXS_CALLER_INSTALLING // LGS deleted the timer Wait Install ACK Success in state XS_CALLER_INSTALLING. *Jul 1 12:46:25:156 2006 Sysname LGS/7/VOICE: LGS_TIMER:[2883633] Create Timer First Dial Success, State:FXS_CALLER_INSTALLING TimeLength:10000 ms // LGS created the timer First Dial Success (10000 ms) in state FXS_CALLER_INSTALLING.
// Ringback expired in state FXS_CALLER_RING_BACK. *Jul 1 12:46:38:820 2006 Sysname LGS/7/VOICE: LGS_TIMER:[2883633] Create Timer Wait ACCP_CONNECT Success, State:FXS_CALLER_RING_BACK TimeLength:60000 ms // LGS created the timer FXS_CALLER_RING_BACK.
*Jul 1 12:46:37:601 2006 Sysname LGS/7/VOICE: LGS_FSM:[2883632] State Change From FXS_CALLED_INSTALLING To FXS_CALLED_ALERTING // State changed from FXS_CALLED_INSTALLING to FXS_CALLED_ALERTING. *Jul 1 12:46:38:206 2006 Sysname LGS/7/VOICE: LGS_FSM:[2883633] State Change From FXS_CALLER_CONNECTING To FXS_CALLER_RING_BACK // State changed from FXS_CALLER_CONNECTING to FXS_CALLER_RING_BACK.
Examples # Enable R2 error debugging. When the caller configured with R2 signaling calls the callee not configured with R2 signaling, output similar to the following example is generated: debugging voice r2 error *Apr 13 10:42:28:687 2007 Sysname R2/7/VOICE: R2_ERROR[D-Invalid]:Allocate VI error. // R2 failed to allocate VI. *Apr 13 10:42:28:688 2007 Sysname R2/7/VOICE: R2_ERROR[D-Invalid]:ACCP message error. // An ACCP message error occurred. # Enable R2 event debugging.
State :[REG_GROUP_A] Stage : [REG_WAIT_CALLEDNUMBER] // R2 received MFC number 3 in REG_GROUP_A state at REG_WAIT_CALLEDNUMBER stage. *Dec 22 10:39:12:285 2006 Sysname R2/7/VOICE: R2_EVENT[I-5/1:0.1]:Send to DRV [ReqNextCalledNum] -- [1]! // R2 sent ReqNextCalledNum 1 to the driver. *Dec 22 10:39:12:436 2006 Sysname R2/7/VOICE: R2_EVENT[O-5/0:0.1]:Send to DRV MFC [MFC_SEND_STOP] -- [0]. // R2 sent MFC_SEND_STOP signal 0 to the driver. *Dec 22 10:39:12:598 2006 Sysname R2/7/VOICE: R2_EVENT[I-5/1:0.
R2_INFO[I-5/1:0.1]:MFC complete. // MFC was completed. *Dec 22 10:36:44:811 2006 Sysname R2/7/VOICE: R2_INFO[D-5/1:0.1]:Deleted Ccb at state CTL_RELEASING: CMC ID : 0x1a0000 Local ID : 0x1b // R2 deleted CCB in state CTL_RELEASING. # Enable R2 timer debugging. debugging voice r2 timer Enable voice r2 timer debugging functions. *Dec 22 10:34:47:225 2006 Sysname R2/7/VOICE: R2_TIMER[O-5/0:0.1]:Start [CTL_VI_INSTALL_TIMER].
error: Voice statistics error debugging. info: Voice statistics internal information debugging. Examples # Enable all types of voice statistics debugging on the originating device. When Telephone 1 (with number 100 and IP address 100.1.1.189) calls Telephone 2 (with number 200 and IP address 100.1.1.188), output similar to the following example is generated: debug voice statistics all #Jun 5 11:03:52:798 2008 Sysname STAT/4/VOICE: 1.3.6.1.2.1.10.21.2.0.
VRRP debugging commands The output description tables in this document only contain fields and messages that require an explanation. The term "router" in this chapter refers to both routers and Layer 3 switches. IPv4 VRRP debugging commands debugging vrrp error Use debugging vrrp error to enable IPv4 VRRP error debugging. Use undo debugging vrrp error to disable IPv4 VRRP error debugging. Syntax debugging vrrp error undo debugging vrrp error Default IPv4 VRRP error debugging is disabled.
debugging vrrp event Use debugging vrrp event to enable IPv4 VRRP event debugging. Use undo debugging vrrp event to disable IPv4 VRRP event debugging. Syntax debugging vrrp event undo debugging vrrp event Default IPv4 VRRP event debugging is disabled. Views User view Default command level 1. Monitor level Usage guidelines Table 1 describes output fields and messages for the debugging vrrp event command.
Field Description Event that occurred on IPv4 VRRP group vrid on interface interface-name: • Adver timer created. • Adver timer deleted. • Hold timer created. • Hold timer deleted. IPv4 interface-name | Virtual Router vrid : event • Hold timer expired. • VF-learning timer created. • VF-learning timer deleted. • VF-learning timer expired. • Request timer created. • Request timer deleted. • Request timer expired. Examples # Enable IPv4 VRRP event debugging. (VRRP operates in standard mode.
[Sysname] vrrp mode load-balance # Create IPv4 VRRP group 1 on interface Ethernet 1/1, and assign virtual IP address 3.1.1.3 to the VRRP group. [Sysname] interface ethernet 1/1 [Sysname-Ethernet1/1] vrrp vrid 1 virtual-ip 3.1.1.3 *Oct 15 13:28:04:797 2008 Sysname VRRP/7/DebugEvent: IPv4 Ethernet1/1 | Virtual Router 1 : Hold timer created // The Hold timer was created.
Syntax debugging vrrp packet [ interface interface-type interface-number [ vrid virtual-router-id ] ] undo debugging vrrp packet [ interface interface-type interface-number [ vrid virtual-router-id ] ] Default IPv4 VRRP packet debugging is disabled. Views User view Default command level 1. Monitor level Parameters interface interface-type interface-number: Specifies an interface by its type and number. vrid virtual-router-id: Specifies a VRRP group by its ID in the range of 1 to 255.
# Create IPv4 VRRP group 1 on interface Ethernet 1/1, assign virtual IP address 3.1.1.3 to the VRRP group, and configure the router priority as 100. system-view [Sysname] interface ethernet 1/1 [Sysname-Ethernet1/1] vrrp vrid 1 virtual-ip 3.1.1.3 *Oct 15 11:24:00:172 2008 Sysname VRRP/7/DebugPacket: Sent Advertisement message from Ethernet1/1 VRID: 1 Pri: 100 Adver timer: 1 secs // Ethernet 1/1 sent an advertisement with VRID 1, router priority 100, and a sending interval of 1 second.
Default IPv4 VRRP state debugging is disabled. Views User view Default command level 1. Monitor level Usage guidelines Table 3 describes output fields and messages for the debugging vrrp state command. Table 251 Output from the debugging vrrp state command Field Description IPv4 VRRP group vrid on interface interface-name transitioned from state1 to state2. VRRP group states: • Created. IPv4 interface-name | Virtual Router vrid : state1 --> state2 • Inactive. • Initialize. • Backup. • Master.
Field Description VF vfid in IPv4 VRRP group vrid on interface interface-name transitioned from state1 to state2 due to reason. VF states: • Initialize. • Listening. • Active. State transition reasons: • Weight changed. • Adding virtual MAC address failed. • Conceded—The AVF dropped the forwarding capability IPv4 interface-name | Forwarder vrid.vfid : state1 --> state2 reason: reason by sending a packet with priority 0. • Learnt from Advertisement. • Reply received. • Release received.
# Enable IPv4 VRRP state debugging. (VRRP operates in load balancing mode.) terminal debugging terminal monitor debugging vrrp state # Specify the load balancing mode for IPv4 VRRP. system-view [Sysname] vrrp mode load-balance # Create IPv4 VRRP group 1 on interface Ethernet 1/1, and assign virtual IP address 3.1.1.3 to the VRRP group. [Sysname] interface ethernet 1/1 [Sysname-Ethernet1/1] vrrp vrid 1 virtual-ip 3.1.1.
Examples # Enable IPv6 VRRP error debugging. (VRRP operates in standard mode.) terminal debugging terminal monitor debugging vrrp ipv6 error *Apr 27 21:56:57:300 2000 Sysname VRRP/7/DebugError: The VRRP Packet is illegal // An illegal VRRP packet was received. # Enable IPv6 VRRP error debugging. (VRRP operates in load balancing mode.) terminal debugging terminal monitor debugging vrrp ipv6 error # Specify the load balancing mode for IPv6 VRRP.
Field Description Event that occurred on VF vfid in IPv6 VRRP group vrid on interface interface-name: • Active timer created. • Tick timer created. • VF instance created. • VF instance deleted. • Active timer deleted. • Offer timer created. IPv6 interface-name | Forwarder vrid.vfid : event • Offer timer deleted. • Offer timer expired. • Tick timer deleted. • Redirect timer expired. • Time-out timer expired. • Forward information updated. • Forward information deleted. • Virtual MAC mac-address added.
*Oct 15 13:12:08:94 2008 Sysname VRRP/7/DebugEvent: IPv6 Ethernet1/1 | Virtual Router 1 : Hold timer created // The Hold timer was created. *Oct 15 13:12:10:313 2008 Sysname VRRP/7/DebugEvent: IPv6 Ethernet1/1 | Virtual Router 1 : Hold timer expired // The Hold timer expired. *Oct 15 13:12:10:313 2008 Sysname VRRP/7/DebugEvent: IPv6 Ethernet1/1 | Virtual Router 1 : Hold timer deleted // The Hold timer was deleted.
// The VF-learning timer was deleted. *Oct 15 13:43:42:985 2008 Sysname VRRP/7/DebugEvent: IPv6 Ethernet1/1 | Virtual Router 1 : Hold timer expired // The Hold timer expired. *Oct 15 13:43:42:985 2008 Sysname VRRP/7/DebugEvent: IPv6 Ethernet1/1 | Virtual Router 1 : Hold timer deleted // The Hold timer was deleted. *Oct 15 13:43:43:00 2008 Sysname VRRP/7/DebugEvent: IPv6 Ethernet1/1 | Virtual Router 1 : Request timer deleted // The Request timer was deleted.
Table 253 Output from the debugging vrrp ipv6 packet command Field Description Sent message-type message from interface-name The message types include Advertisement, Request, Reply, and Release. Received message-type message from ip-address on interface-name The message types include Advertisement, Request, Reply, and Release. VRID VRRP group ID. Pri Priority of the master or the VF. Adver timer VRRP advertisement sending interval in centiseconds. Weight Weight of the VF.
*Oct 15 13:35:38:344 2008 Sysname VRRP/7/DebugPacket: Sent Request message from Ethernet1/1 VRID: 1 MAC: 0000-5e01-1101 IP: FE80::1 // A request with MAC address 0000-5e01-1101 and IP address FE80::1 was sent from Ethernet 1/1. *Oct 15 13:35:40:719 2008 Sysname VRRP/7/DebugPacket: Sent Advertisement message from Ethernet1/1 VRID: 1 Pri: 100 Adver timer: 100 centisecs // Ethernet 1/1 sent an advertisement with VRID 1, router priority 100, and a sending interval of 1 second.
Table 254 Output from the debugging vrrp ipv6 state command Field Description IPv6 VRRP group vrid on interface interface-name transitioned from state1 to state2. VRRP group states: • Created. IPv6 interface-name | Virtual Router vrid : state1 --> state2 • Inactive. • Initialize. • Backup. • Master. • Deleted. IPv6 VRRP group vrid on interface interface-name transitioned from state1 to state2 due to reason. VRRP group states: • Created. • Inactive. • Initialize. • Backup. • Master.
Field Description VF vfid in IPv6 VRRP group vrid on interface interface-name transitioned from state1 to state2 due to reason. VF states: • Initialize. • Listening. • Active. State transition reasons: • Weight changed. • Adding virtual MAC address failed. IPv4 interface-name | Forwarder vrid.vfid : state1 --> state2 reason: reason • Conceded—The AVF dropped the forwarding capability by sending a packet with priority 0. • Learnt from Advertisement. • Reply received. • Release received.
// VRRP group 1 transitioned from Backup to Master when it received no advertisement within 3 times the advertisement sending interval. # Enable IPv6 VRRP state debugging. (VRRP operates in load balancing mode.) terminal debugging terminal monitor debugging vrrp ipv6 state # Specify the load balancing mode for IPv6 VRRP.
WEB filtering debugging commands debugging firewall http url-filter host Use debugging firewall http url-filter host to enable debugging for URL address filtering. Use undo debugging firewall http url-filter host to disable debugging for URL address filtering. Syntax debugging firewall http url-filter host { event | packet } undo debugging firewall http url-filter host { event | packet } Default Debugging for URL address filtering is disabled.
Default Debugging for URL parameter filtering is disabled. Views User view Default command level 2: System level Parameters event: Specifies event debugging. packet: Specifies packet debugging. Examples # Enable packet debugging for URL parameter filtering. Output similar to the following example is generated when a client on the private network accesses www.webfilter.com/parares.
Examples # Enable packet debugging for Java applet blocking. Output similar to the following example is generated when a client on the private network accesses www.webfilter.com/alcsfnow.class under the following conditions: • The Java applet blocking function is configured on the device. • The function denies Web requests containing Java applet. debugging firewall http activex-blocking packet *Feb 24 10:33:58:500 2007 Sysname DPALG/7/debug: Java applet blocking replaced the suffix.