
HP Intelligent Management Center v5.2 Application Performance Manager Administrator Guide


106
Contact—Modify the user contact information, such as name, email address, and telephone
number.
Related Applications—Modify the applications that FreeBSD depends on. Click Add, and then
select applications in the popup Select Applications window. Operating system applications,
such as Windows, AIX, FreeBSD, OpenBSD, HP-UX, Solaris, Mac OS, and Linux, cannot be
selected. The overall dependencies between applications can be viewed in the application
topology. To remove dependencies between FreeBSD and one or more applications, select the
target applications in the Related Applications box and click Delete.
Detect Application—Select this parameter if you want to enable application detection.
Application detection enables APM to verify connection to the application by using the previous
parameter settings, and to determine whether to modify the application monitor based on the
verification result. APM modifies the application monitor only when it can connect to the
application. When this parameter is not selected, APM modifies the application monitor without
verifying the connection.
6. Click OK.
Viewing the FreeBSD application monitor report
After a FreeBSD application monitor is added, APM collects index data of the application, and
calculates its availability and health status. Obtain monitor indexes for FreeBSD by viewing the monitor
report.
To access the FreeBSD application monitor report:
1. Click the Resource tab.
2. Select Application Manager > Application Monitor from the navigation tree.
The application monitor list page displays all application monitors.
3. Click the link naming the desired FreeBSD application monitor.
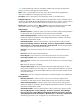
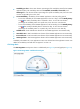
The FreeBSD monitor report appears, as shown in Figure 30. For information about the icons in the
monitor report, see "2 Quick start." This section describes the fields in each area of the monitor
report.
Figure 59 Part of a FreeBSD application monitor report
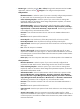
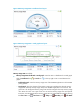
Monitor Information
The Monitor Information area layout is shown in Figure 60.