
HP Intelligent Management Center v5.2 Application Performance Manager Administrator Guide

116
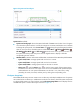
Output Error Packet Loss—Number of lost outbound error packets per second on a network
interface card in the last APM polling period.
Process
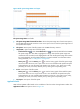
To monitor a process on FreeBSD, click the Configuration icon to select the processes to be
monitored. APM collects the index data for the monitored processes during the next host polling, which
includes the CPU usage ratio and memory usage ratio. The monitored processes and the corresponding
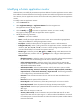
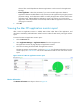
index data is displayed in the Process area, as shown in Figure 71.
Figure 71 Process area layout
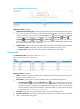
Process area fields:
Configuration icon —Click the Configuration icon to select the processes to be monitored
in the monitor list window.
Process—Name of the monitored process. APM can respectively collect monitored data for the
processes that have the same name, but different in Process Identifier (PID).
CPU Usage Ratio—CPU usage ratio of the monitored process in the last APM polling period.
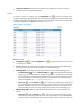
Set Threshold icon —Click the Threshold setting icon to set alarm thresholds of the CPU
usage ratio for the monitored process. The data is highlighted in orange when the CPU usage
ratio reaches the level-1 threshold, and is highlighted in red when the CPU usage ratio reaches
the level-2 threshold. Use the global thresholds or custom thresholds. For information about
setting the thresholds, see "5 Configuration management."
History icon —Click the History icon to view the history graph of the CPU usage ratio of
the monitored process. Hover the cursor over a spot on the curve to view the data at the specific
time point. Authorized users can view CPU usage statistics over the last 1 hour, last 6 hours,
today, yesterday, this week, this month, and this year by clicking the corresponding icons.
Memory Usage Ratio—Memory usage ratio of the monitored process in the last APM polling
period.
History icon —Click the History icon to view the history graph of the memory usage
ratio of the monitored process. Hover the cursor over a spot on the curve to view the data at the
specific time point. Authorized users can view memory usage statistics over the last 1 hour, last