
HP Intelligent Management Center v5.2 Application Performance Manager Administrator Guide


216
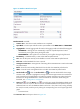
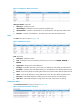
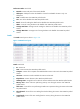
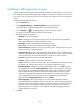
Figure 164 SGA Details area layout
SGA Details area fields (Values were obtained when APM last polled Oracle.):
Buffer—Size of buffer cache in SGA.
Fixed Area—Size of the fixed area in SGA. The fixed area, usually in small size, contains control
information for other SGA regions.
REDO Log Buffer—Size of the redo log buffer in SGA.
Shared Pool—Size of the shared pool in SGA.
Database Buffer—Size of the library cache in SGA.
Dictionary Buffer—Size of the dictionary cache in SGA.
SQL Area—Size of the SQL area in SGA .
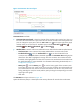
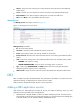
History icon —Click the History icon to view the history graph of the SGA details trend.
Hover the cursor over a spot on the curve to view the SGA details trend at the specific time point.
Authorized users can view SGA statistics over the last 1 hour, last 6 hours, today, yesterday, this
week, this month, and this year by clicking the corresponding icons on the upper right of the graph.
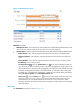
Application Traffic
APM collects Oracle traffic based on the IP address of the host and the traffic collection port used by the
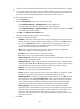
application. The Application Traffic area layout is shown in Figure 165.
Figure 165 Application Traffic area layout
Application Traffic area fields:
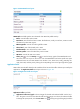
Application Traffic trend graph—Shows changes of inbound and outbound traffic over the last 1
hour. The green curve shows the inbound traffic and the orange curve shows the outbound traffic.
To change the report period, click the Last 1 Hour icon on the upper right of the graph, and then