
HP Intelligent Management Center v5.2 Application Performance Manager Administrator Guide

16
Critical—The application is available and the monitored indexes collected by APM meet the
condition of a Level-2 threshold, or the application is unavailable. This health status can trigger
a critical alarm.
Unknown—The application is inaccessible or unmanaged. This health status is represented by
two consecutive hyphens (--) in APM.
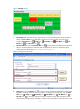
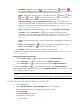
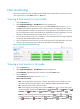
Table 2 Relationship among management state, availability, and health status
Management Status
Availability
Health status
Managed
Available
Healthy, Minor, Major, or Critical
Managed
Unavailable
Critical
Managed
Inaccessible
Unknown
Unmanaged
Unmanaged
Unknown
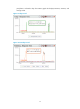
Viewing the application monitor list
1. Click the Resource tab.
2. Select Application Manager > Application Monitor from the navigation tree.
The application monitor list page displays all application monitors. Information on the list was
obtained when APM last polled the monitored applications.
Application monitor list contents
Name—Name of the application monitor. Click the name to view the monitoring report for the
monitored application.
Application Type—Type of the monitored application. Click the link for the application type to
filter out other types of monitored applications. For more information about application type
management, see "1 Application Manager overview."
Host—IP address of the host on which the monitored application resides. This field does not
appear by default.
Speed (bps)—Total receiving and sending rate of the application, in bps. This field appears
only when probes are configured for APM. For information about configuring probes, see
"Probe Configuration."
Rx (bps)—Receiving rate of the application, in bps. This field does not appear by default.
Tx (bps)—Sending rate of the application, in bps. This field does not appear by default.
Traffic (H)—Total traffic received and sent by the application in the last hour. This field does not
appear by default.
In Traffic (H)—Traffic received by the application in the last hour. This field does not appear by
default.
Out Traffic (H)—Traffic sent by the application in the last hour. This field does not appear by
default.
Traffic (D)—Total traffic received and sent by the application today. This field does not appear
by default.
In Traffic (D)—Traffic received by the application today. This field does not appear by default.
Out Traffic (D)—Traffic sent by the application today. This field does not appear by default.