
HP Intelligent Management Center v5.2 Application Performance Manager Administrator Guide


244
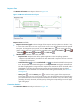
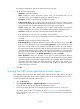
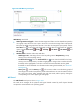
Figure 195 Connection Statistics area layout
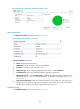
Connection Statistics area fields:
Connection Statistics trend graph—Shows changes of the connections and remote connections
used by Sybase over the last 1 hour in a line chart. Hover the cursor over a spot on the curve to view
the number of connections and remote connections at the specific time point. To change the report
period, click the Last 1 Hour icon on the upper right of the graph, and then select an icon from
the list. Available options include Last 6 Hours , Today , Yesterday , This Week , This
Month , and This Year .
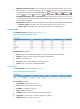
Attribute/Value—Monitor index name and data.
Max Connections—Maximum number of concurrent connections that allowed by Sybase.
Max Remote Connections—Maximum number of concurrent remote connections that allowed
by Sybase.
Connections—Concurrent connections when APM last polled Sybase.
Remote Connections—Concurrent remote connections when APM last polled Sybase.
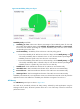
History icon —Click the History icon to view the history graph of the connection trend.
Hover the cursor over a spot on the curve to view the connections at the specific time point.
Authorized users can view connection statistics over the last 1 hour, last 6 hours, today,
yesterday, this week, this month, and this year by clicking the corresponding icons on the upper
right of the graph.
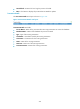
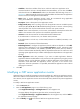
Application Traffic
APM collects Sybase traffic based on the IP address of the host and the traffic collection port used by the
application. The Application Traffic area layout is shown in Figure 196.
Figure 196 Application Traffic area layout
Application Traffic area fields: