
HP Intelligent Management Center v5.2 Application Performance Manager Administrator Guide


263
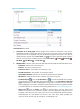
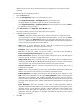
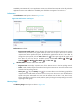
Figure 213 Stack area layout
Stack area fields:
Current stacks trend graph—Shows changes of the current stack size over the selected time period
in a line chart. Hover the cursor over a spot on the curve to view the stack size at the specific time
point. By default, the graph shows the last 1 hour data. To change the report period, click the Last
1 Hour icon on the upper right of the graph, and then select an icon from the list. Available
options include Last 6 Hours , Today , Yesterday , This Week , This Month , and
This Year .
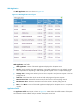
Attribute/Value—Monitor index name and data obtained when APM last polled the JBoss server.
Total Stacks—Total size of the stack the operating system allocated to the JBoss server.
Current Stacks—Size of the stack that is currently in use in the JBoss server.
Free Stacks—Size of the free stack in the JBoss server.
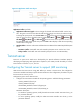
History icon —Click the History icon to view history graph of the current stack size trend.
Hover the cursor over a spot on the curve to view the stack size at the specific time point.
Authorized users can view statistics over the last 1 hour, last 6 hours, today, yesterday, this
week, this month, and this year by clicking the corresponding icons.
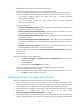
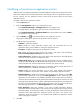
Connection Pool
The Connection Pool area is shown in Figure 214.