
HP Intelligent Management Center v5.2 Application Performance Manager Administrator Guide


282
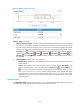
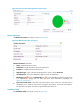
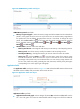
Figure 230 OPMN Memory Details area layout
OPMN Memory Details area fields:
Memory usage trend graph—Shows the memory usage trend of the OPMN over the selected time
period in a line graph. Hover the cursor over a spot in the curve to view the memory usage data at
the specific time point. By default, the graph shows the last 1 hour data. To change the report
period, click the Last 1 Hour icon on the upper right of the graph, and then select an icon from
the list. Available options include Last 6 Hours , Today , Yesterday , This Week , This
Month , and This Year .
Attribute/Value—Monitor index name and data.
Memory Used Percent—Percentage of used memory to total memory in the last polling interval.
Memory Used—Size of the memory used by the OPMN in the last polling interval.
Total Physical Memory—Total physical memory of the host where the Oracle AS resides.
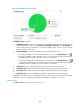
History icon —Click the History icon to view the history graph of the memory usage
trend of the Oracle AS. Hover the cursor over a spot on the curve to view the free memory
percentage at the specific time point. Authorized users can view memory usage statistics over
the last 1 hour, last 6 hours, today, yesterday, this week, this month, and this year by clicking the
corresponding icons on the upper right of the graph.
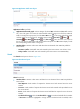
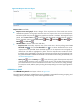
Application Traffic
The Application Traffic area layout is shown in Figure 231. APM collects the traffic statistics of the Oracle
AS based on the IP address and port number of the Oracle AS host.
Figure 231 Application Traffic area layout
Application Traffic area fields:
Application Traffic trend graph—Shows changes of inbound (Rx) and outbound (Tx) traffic over the
last 1 hour. The green curve shows the inbound traffic and the orange curve shows the outbound