
HP Intelligent Management Center v5.2 Application Performance Manager Administrator Guide

293
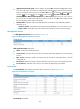
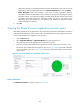
Application Traffic trend graph—Shows changes of inbound (Rx) and outbound (Tx) traffic over the
last 1 hour. The green curve shows the inbound traffic and the orange curve shows the outbound
traffic. To change the report period, click the Last 1 Hour icon on the upper right of the graph,
and then select an icon from the list. Available options include Last 6 Hours , Today ,
Yesterday , This Week , This Month , and This Year . Hover the cursor over a spot on
the curve to view the application traffic at the specific time point. Click Rx or Tx to display or hide
the corresponding monitor index in the graph.
Attribute/Value—Monitor index name and data that was obtained when APM last polled the
WebLogic server.
Last Hour's Traffic—Total traffic sent and received by the WebLogic server over the last 1 hour.
Today's Traffic—Total traffic sent and received by the WebLogic server since 00:00 today.
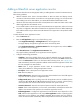
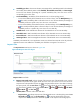
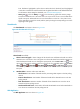
Web Application Details
The Web Application Details area is as shown in Figure 242.
Figure 242 Web Application Details area layout
Web Application Details area fields:
Name—Name of the Web application.
Current Session—Number of sessions that were accessing the Web application in the last polling
interval.
Max. Session—Maximum number of sessions that can access the Web application in the last
polling interval.
Session Pool—Maximum number of sessions allowed in the session pool in the last polling interval.
Session Timeout—Maximum time a session can remain idle before being terminated.
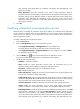
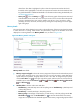
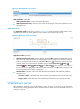
Servlet Details
The Servlet Details area displays information about 10 servlets, as shown in Figure 243.
Figure 243 Servlet Details area layout
Servlet Details area fields: