
HP Intelligent Management Center v5.2 Application Performance Manager Administrator Guide


332
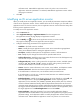
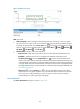
Application Traffic trend graph—Shows changes of inbound and outbound traffic over the last 1
hour. The green curve shows the inbound traffic and the orange the outbound traffic. To change the
report period, click the Last 1 Hour icon on the upper right of the graph, and then select an icon
from the list. Available options include Last 6 Hours , Today , Yesterday , This Week
, This Month , and This Year . Hover the cursor over a spot on the curve to view the
application traffic at the specific time point. Click Rx or Tx to display or hide the corresponding
monitor index in the graph.
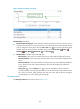
Attribute/Value—Monitor index name and data that was obtained when APM last polled the IIS
server.
Last Hour's Traffic—Total traffic received and sent by the IIS server over the last 1 hour.
Today's Traffic—Total traffic received and sent by the IIS server since 00:00 today.
PHP
Hypertext Preprocessor (PHP) is a scripting language embedded in the HTML text, and is usually used to
develop Web programs. When a user accesses Web pages developed by using the PHP language, the
Web server first delivers the Web pages with the PHP language embedded to the PHP service for parsing,
and then sends the parsed pages to the user. APM can monitor the PHP service, which is responsible for
parsing pages.
This section describes how to add/modify a PHP application monitor and the details of PHP application
monitor reports.
Adding a PHP application monitor
APM monitors whether PHP is running properly through the Web service port (TCP 80 by default). APM
requests for PHP pages from the Web server as a client, and determines whether the PHP service can
normally parse the PHP pages according to the returned results. When you add a PHP server application
monitor, follow these guidelines:
Add the PHP server hosts to the IMC platform so APM can obtain and display network connections
of the hosts and their access devices in the application topology. For information on adding hosts
to the IMC platform, see HP IMC Base Platform Administrator Guide.
To view traffic statistics in the monitor report of the PHP server, make sure at least one probe is
configured in APM. After a PHP server monitor is added, APM sends the IP address of the monitored
PHP server to the probes for traffic collection.
To add a PHP application monitor:
1. Click the Resource tab.
2. Enter the Add Application page in one of the following ways:
Select Application Manager > Add Application from the navigation tree.
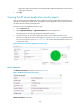
The page displays all application types that can be monitored by APM.
Select Application Manager > Application Monitor from the navigation tree. Click Add on the
application monitor list page.
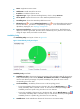
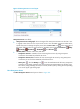
3. Click PHP of the Web Server Monitor class.
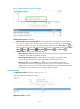
The page for adding a PHP application monitor appears.
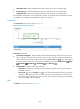
4. Configure the following parameters for the application monitor: