
HP Intelligent Management Center v5.2 Application Performance Manager Administrator Guide

449
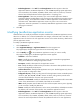
Set Threshold icon —Click the Set Threshold icon to set alarm thresholds for the used
memory. The specified alarm thresholds appear on the Ping Test trend graph as dotted lines.
The data is highlighted in orange when the used memory reaches the level-1 threshold, and is
highlighted in red when the used memory reaches the level-2 threshold. Use the global
thresholds or custom thresholds. For information about setting the thresholds, see "Threshold
Management."
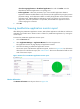
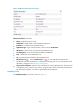
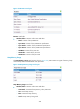
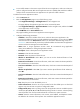
NonHeap Memory Usage
The NonHeap Memory Usage area layout is shown in Figure 375.
Figure 375 NonHeap Memory Usage area layout
NonHeap Memory Usage area fields:
Attribute/Value—Monitor index name and data.
Committed—Committed non-heap memory when JVM starts.
Init—Initial non-heap memory.
Max—Maximum non-heap memory.
Used—Non-heap memory being used.
Set Threshold icon —Click the Set Threshold icon to set alarm thresholds for the used
memory. The specified alarm thresholds appear on the Ping Test trend graph as dotted lines.
The data is highlighted in orange when the used memory reaches the level-1 threshold, and is
highlighted in red when the used memory reaches the level-2 threshold. Use the global
thresholds or custom thresholds. For information about setting the thresholds, see "Threshold
Management."
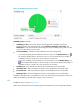
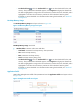
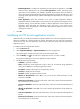
Application Traffic
APM collects JRE application traffic of the JavaRuntime host. The Application Traffic area layout is shown
in Figure 376.
Figure 376 Application Traffic area layout