
HP Intelligent Management Center v5.2 Application Performance Manager Administrator Guide

70
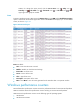
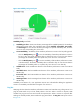
Performance Counter area fields:
Config icon —Click the Config icon . APM populates the Application Instance List with all
detected performance counters on the Windows operating system. Select desired performance
counters and click OK. APM collects index data of the selected performance counters in the next
polling interval.
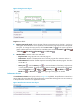
Category—Category of the performance counter. The performance counter category corresponds
to the level-1 menu item in the left navigation tree of the Application Instance List window.
Instance—Instance of the performance counter category. For example, the
Win32_PerfFormattedData_PerfOS_Processor category contains four instances, 1, 2, 3, 4, and
_Total, which in turn represent CPU cores 1, 2, 3, 4, and the total CPU. The instance corresponds
to the level--2 menu item in the left navigation tree of the Application Instance List window.
Attribute/Value—Performance counter name and data.
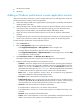
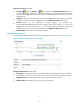
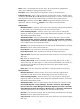
Datagrams Received Per sec
This area displays detailed information of each monitored performance counter, as shown in Figure 29.
Figure 29 Datagrams Received Per sec area layout
Datagrams Received Per sec area fields:
Trend graph—Shows changes of the monitor index data of the performance counter over the last 1
hour. Hover the cursor over a spot on the curve to view the index data at the specific time point.
Category/Instance—Category and instance name of the performance counter.
Attribute/Value—Index data collected in the last polling interval.