
HP Intelligent Management Center v5.2 Application Performance Manager Administrator Guide


85
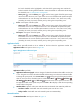
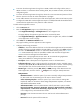
Figure 42 Error Log area layout
Error Log area fields:
Time—Time when the error occurred.
Log—Content of the error log.
More—Click More to view all error logs in last polling of the AIX system.
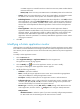
Process
To monitor a process on AIX, click the Configuration icon to select the processes to be monitored.
APM collects the index data for the monitored processes during the next host polling, which includes the
CPU usage ratio and memory usage ratio. The monitored processes and the corresponding index data
are displayed in the Process area, as shown in Figure 43.
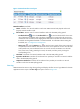
Figure 43 Process area layout
Process area fields:
Configuration icon —Click the Configuration icon to select the processes to be monitored
in the monitor list window.
Process—Name of the monitored process. APM can respectively collect index data for the
processes that have the same name, but different in Process Identifier (PID).
CPU Usage Ratio—CPU usage ratio of the monitored process in the last APM polling period.