HP Intelligent Management Center Application Manager Administrator Guide Abstract This guide provides instructions for using IMC Application Manager. It includes information on prerequisites, service monitor management, widget management, port configuration, and application group management. Part number: 5998-3312 Software version: IMC PLAT 5.
© Copyright 2012 Hewlett-Packard Development Company, L.P. No part of this documentation may be reproduced or transmitted in any form or by any means without prior written consent of Hewlett-Packard Development Company, L.P. The information contained herein is subject to change without notice. HEWLETT-PACKARD COMPANY MAKES NO WARRANTY OF ANY KIND WITH REGARD TO THIS MATERIAL, INCLUDING, BUT NOT LIMITED TO, THE IMPLIED WARRANTIES OF MERCHANTABILITY AND FITNESS FOR A PARTICULAR PURPOSE.
Contents 1 Application Manager overview ····························································································································1 Installation and network planning ··································································································································· 1 Installation requirements ·········································································································································· 1 APM networ
Viewing custom monitor details ··························································································································· 23 Adding a custom monitor ····································································································································· 23 Modifying a custom monitor ································································································································ 24 Deleting a custom monitor·········
Viewing Solaris monitoring report ······················································································································· 81 FreeBSD··········································································································································································· 93 Configuring FreeBSD monitor ······························································································································ 93 Viewing FreeBSD
Adding an IIS server application monitor········································································································· 228 Modifying an IIS server application monitor ···································································································· 229 Viewing the IIS server application monitor report ··························································································· 230 PHP ·······························································
16 File/Directory monitor ···································································································································· 317 File ················································································································································································· 317 Adding a file application monitor ····················································································································· 317 Modify
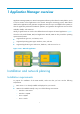
1 Application Manager overview Application Manager (APM) is a network management software product based on IMC platform, and it is used to monitor various applications in the network. During the monitoring process, APM collects data from the applications and generates an application monitor report. It is helpful for the operators to solve the application performance bottleneck problems, and guarantee the significant services will be available, reliable, and continuous.
• A connection to a supported database is available for the APM deployment. The APM installation procedures are similar with other IMC modules, for more information, see IMC Installation Guide. NOTE: Monitoring applications via WMI is available when the APM is installed in the Windows + SQL Server or Windows + MySQL environment. APM network planning APM can be used in various scenarios, and the most classic one is monitor the applications in a data center as Figure 2 shown.
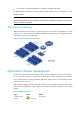
Type Name Windows Details Windows Server 2003/2008 Server Unix Server Monitor AIX Solaris FreeBSD Mac OS OpenBSD HP-UX Linux Server Monitor AIX 5.4 and higher version Solaris 5.10 and higher version FreeBSD 8.2 and higher version Mac OS X Server 10.1.5 and higher version OpenBSD 4.6 and higher version HP-UX 11.00 and higher version。 Ubuntu Linux Redhat SUSE Cent OS and so on Database Server Monitor SQL Server MySQL Oracle Application Server Monitor .
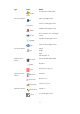
Type Name Mail Server Monitor Exchange 2003 Exchange 2007 Web Service Monitor REST Service SOAP Service LDAP Service Monitor File system Monitor Active Directory FILE Directory Service Monitor SNMP Service Details Exchange 2003 Exchange 2007 n/a n/a Active directory deployed in the Windows Server 2003/2008 n/a n/a n/a APM communication management APM monitor the application by means of the following ways: • SNMP Simple Network Management Protocol (SNMP) supported broadly by the operating
• Service port APM can collect the monitor index by the applications service port, such as SQL Server-1433, MySQL-3306 and Oracle-1521. APM is able to get monitor index from those applications through their service ports. Also, it is applicable to operators to modify the service ports.
Application group management APM divides applications into several groups according to the different authorities of user. A new adding application cannot be added into any group automatically, which means any users such as administrators, maintainers, or even viewers is applicable to check its application monitor report. So be sure to add the applications into groups to make the authority more clear. For more information, see "Application group management.
2 Quick start This section provides instructions on how to monitor applications and view the monitoring report for administrators that use the APM service module for the first time, or want to add the application monitors in batches. Prerequisites To monitor an application in APM, you first need to complete the following operations: 1. Obtain information related to the target application, including application type, host IP address of the application, and administrators that manage the application. 2.
Two ways to add an application monitor are: • Adding an application monitor via auto-discovery • Adding an application monitor manually Adding an application monitor via Auto-discovery With the auto-discovery function, APM can automatically detect the applications running on the target hosts through the host listening ports, and display the detected application list for you to select the applications to be monitored. HP recommends that you use this function when adding application monitors in batches.
Location—Input the location information you want to search for. Device Reachability—Select device reachability status from the Device Reachability dropdown list. The resulting devices display in the Devices Found list. 5. After the devices appear in the Devices Found box, highlight and click the appropriate hosts. 6. Use the Add Selection icon to add the hosts to the Selected Devices box. If you want to remove a selected device, highlight the device and click the Remove Selected icon .
To add an application monitor manually: 1. Click Resource > Application Management. 2. In the navigation tree, click Add Application. 3. In the Add Application page, click the icon of the target application type to open the corresponding adding application page. 4. Specify the corresponding parameters of the application you want to monitor, and then click OK. To monitor different types of applications, you need to specify different parameters.
Type Operation Exchange 2003 Exchange 2007 REST Service SOAP Service Active Directory File Monitor Directory Monitor SNMP Monitor Viewing monitoring report After adding an application monitor to the monitoring list, APM start collecting and analyzing the monitored indexes of the application, and displays all index data and performance evaluation result in a monitoring report.
Unavailable—Indicate APM cannot connect with the target application, which can trigger a critical alarm. Unmanaged—Indicate the target application is not monitored by APM. If the management state is Unmanaged, the availability of the application turns to be unmanaged. NOTE: You can view the current availability of an application in the Application Monitor list. After you click the name of the application to open the monitoring report, you can view the statistics of the application availabilities.
Table 4 Monitoring report introduction Type Monitoring report Windows XP Windows Server AIX Viewing AIX monitoring report Solaris Viewing Solaris monitoring report FreeBSD Viewing FreeBSD monitoring report Mac OS Viewing Mac OS monitoring report OpenBSD Viewing OpenBSD monitoring report HP-UX Viewing HP-UX monitoring report Linux SQL Server MySQL Oracle .
To analyze the root cause of unhealthy applications: 1. Click the Analyze icon shown in Figure 3. in the monitoring report of a specified unhealthy application, as Figure 3 Monitoring report 2. In the Analyze page (Figure 4), click the related nodes to view the details, and identify the root cause of unhealthy state. APM displays all related information as nodes, which including CPU, memory, disks, interfaces, and so forth.
3 Monitor management Monitor management is an important feature in APM. The monitor is used to collect the performance indexes, health status, availability and so forth. The monitor management displays the analysis and statistics reports base on these data and information. • Monitor The monitor summarizes a group parameters and configurations, it collects the application indexes data to analysis the health status and the availability. Each application only has one monitor.
• Health Status—Specify the health statuss of the applications for the last polling query, includes: Health, Minor, Major, Critical and Unknown. Put the mouse on the icon of health status to view the application health status in last hour, different colors stand for the different health status. • Manage Status-Specify the application management status, include Managed and Unmanaged. • Contact -Specify the contact information of the application administrator.
5. Click the shift up/shift down icon monitor list. / to modify the rank of the columns in the application 6. Click OK to complete the process. 7. Click Reset button to reset the value as default value. Querying an application monitor To query an application monitor: 1. Click Resource Tab. 2. In the navigation tree, click Application management>Application monitor in the menu. You can view Application monitor list. 3.
Application type Adding application monitor Windows server Adding Windows Server application monitor AIX Adding AIX application monitor Solaris Adding Solaris application monitor FreeBSD Adding FreeBSD application monitor Mac OS Adding Mac OS application monitor OpenBSD Adding OpenBSD application monitor HP-UX Adding HP-UX application monitor Linux Adding Linux application monitor SQL Server Adding SQL Server application monitor MySQL Adding MySQL application monitor Oracle Adding Ora
4. Click OK button. Different types of the application monitors match different parameters, for more information see Table 5. Please note that you cannot modify the type of the application monitor and the IP address. Deleting monitoring application The application monitor which used by the custom monitor is not allowed to be deleted. When the application monitor is deleted, all of the application monitor index data is cleared. To delete application monitor 1. Select Resource tab. 2.
1. Select Resource tab. 2. In the navigation, select Application Management >Application Monitor in the menu. The page displays Application Monitor list. 3. Tick the checkbox to select the application monitor to do the start polling operation. 4. Click the Start Polling button, the monitor collects the application monitor index data. Host monitor Host monitor includes Host mode and List mode; it mainly focuses on the availability and the health status of the host.
4. Figure 6 is shown as host mode. Figure 6 Host monitor list The content of host monitor list is as follows: 5. Host—Indicates the equipment label of the host machine. Click the equipment label to view the specific information of the host machine. More information on the equipment, please refer to the Resource Management in IMC Base Platform Administrator Guide. Operation System—Indicates the operation system used in the host machine.
Figure 7 Class monitor • The different background colors stand for the health status of the application types. The health status depends on the worst health status. • [N/M],N is the application number in health status, M is the number of all the applications. Click the application type name to view the types of the application monitor. Put mouse on the application type name, you can the detail of the health status, for example, Healthy: 1, Critical: 0, Major: 0, Minor: 0,--:0.
• Name—Specify the custom monitor name. • Description—specify the detail of the custom monitors. • View-Click the view icon • Modify-Click the modify icon • Delete-Click the delete icon 3. Click Fresh button to update the content of the custom monitor list. to view the custom monitors reports. to modify the custom monitors. to delete the custom monitors. Viewing custom monitor details To view the custom monitor details: 1. Click Resource tab. 2.
b. Select the Application Index for the custom monitor. c. Click OK button, the index which is selected in the last step will display in the application index list. 5. Click the Move up/ Move down icon / to change the arrangement of the monitor indexes which display in the custom report. The index which is in the front row in the application index list, will display in the front row in the custom report. 6. Click OK button. Modifying a custom monitor To modify custom monitors: 1. Select Resource tab.
4. Click OK to confirm this operation. Viewing a custom monitor report To view a custom monitor report: 1. Select Resource tab. 2. In the navigation tree, select Application Management>Custom Monitor in the menu. You can see all of the custom monitors. 3. Click the report icon to view the custom monitor reports. The custom monitor reports display the different content with the different monitor indexes.
Application type Application monitor reports SNMP server SNMP Service application monitor report Note: The monitor index can set the threshold value; this threshold value is as same as the value in the application monitor report. If you modify the threshold value in the custom monitor report, the threshold value in the application monitor report will also be changed. More information on threshold value setting, please see the threshold value management.
4 Application group Application group function is convenient for the operator to manage and monitor the health status and availability of different applications. Besides, the applications are available to be grouped by different authority. Each operator group has a specific authorization to view the application monitor report. A new adding application belongs to “Ungrouped”, which can be accessed by any operator.
NOTE: Ungroup is predefined by the APM system, it cannot be modified, deleted or added a subgroup. A new application is added into “Ungrouped” automatically, any user is applicable to check its monitor report. So if you want to keep some application monitor reports secret, please move the application to the corresponding group manually. Viewing the group details To view the group details: 1. Click Resource>Application Management. 2.
9. Click OK. Modifying the application group To modify the application group: 1. Click Resource>Application Management. 2. In the navigation tree, click Application Group, and then all groups is listed. 3. Click the modify icon 4. Specify a unique new name for the application group in the Name box. 5. Describe the application group in the Description box. 6. Select the operator groups who are applicable to view this application monitor report. to open the Modify page. a.
5 Threshold and Port configuration APM provides you some extra configuration management functions: • Threshold Configuration—enables you set threshold conditions for the monitoring application indexes. If the collected indexes meet the threshold, system sends a corresponding alarm. • Port Configuration—enables you set a default listening port for the application. Auto Discovery function scans the applications running in the host through the default listening port automatically.
• Level-1 Threshold—Displays the Level-1 threshold value of the monitor index. • Enable Level-2 Threshold—Displays whether or not enable the Level-2 threshold for the monitor index. • Level-2 Threshold—Displays the Level-2 threshold value of the monitor index. • Modify—Modify the global threshold values. To flip the global threshold list: • Click the previous icon to page up. • Click the next icon • Click the go to the first page icon • Click the go to the last page icon to page down.
Application Type—It is not applicable to be modified. Index—It is not applicable to be modified. Threshold Type—It is not applicable to be modified. 6. Threshold Condition—Specify the threshold condition, the available options are greater than or equal to and less than or equal to. Unit—Specify the unit for the threshold, its value is depended on the monitor index type. Specially, some index does not have a unit, such as the physical thread count of .Net server.
5. Unit—Specify the unit for the threshold, its value is depended on the monitor index type. Specially, some index does not have a unit, such as the physical thread count of .Net server. Enable Level-1 Threshold—Enable or Disable the Level-1 threshold for the monitor index. Threshold —Specify the threshold condition, APM will activate the related major alarm when the monitor index meets the threshold. Enable Level-2 Threshold—Enable or Disable the Level-2 threshold for the monitor index.
Application Type Monitor Mode Monitor Port Oracle Get the monitor index value by the service port. Oracle-1521 MySQL MySQL-3306 Apache Apache-80 Viewing the application default port list To view the application default ports list: 1. Click Resource > Application Management. 2. In the navigation tree, click Configuration Management. 3. Click Port Configuration to open the Default Configuration List.
6 Widget management APM provides you custom the application monitor widget on the IMC home page and layout them by using the Widget Management. For more information, see IMC Base Platform Administrator Guide. Application monitor widget Figure 8 shows the Application Monitor widget. In the widget, you can monitor the Availability and Health Status of applications directly, and open the application monitor report by clicking the application name.
Name—Specify an application name. Application Type—Select an application type in the drop-down list. The available options are listed in the Table 1. Availability—Select an availability in the drop-down list. The available options include Unlimited, Available, Inaccessible, Unavailable, and Unmanaged. Health Status—Select a health status in the drop-down list. The available options include Unlimited, Healthy, Minor, Major and Critical. 6. Click Query to display the target applications. 7.
The host monitor widget will be refreshed in every 10 minutes by default. Operators can set the refresh interval for the target host. Setting refresh interval To set the refresh interval for the host monitor widget: 1. Log on the IMC, and add an application monitor widget in the home page. 2. Move the mouse to the right top corner of the Application Monitor pane. 3. Click the configuration icon 4. Click Interval Settings to open the Setting page. 5.
7 Windows OS monitor APM provides the Windows OS monitoring function that monitors the following: • Windows XP • Windows Server Windows Server that can be monitored includes Windows Server 2003 and Windows Server 2008. This chapter describes how to add and modify Windows OS application monitors, and helps you view relevant monitor reports. Windows XP Windows XP provides a base platform for a variety of desktop-oriented applications.
Name—Enter the application monitor name, which must be unique in APM. HP recommends that you use the Application name_host IP address format to name the application monitor. Description—Enter a description for the application monitor to aid maintenance. IP Address—Click Select and select the host where the Windows XP operating system is installed in the Select Devices window. Polling Interval (min)—Select a polling interval for the application monitor.
IP Address—This field cannot be modified. Polling Interval (min)—Select a polling interval for the application monitor. Available options include 1, 2, 3, 4, 5, 10, 20, and 30. The default polling interval is 5 minutes. A shorter polling interval provides more accurate real-time data, but requires higher performance. Monitor Type—Select a monitor type for the application monitor. Monitor types include SNMP and WMI. Username—This field appears only when you select WMI for Monitor Type.
Figure 10 Part of a Windows XP application monitor report The previous monitor report is for the application monitor named WindowsXp_192.168.20.204. The health status of the Windows XP application is Healthy . If another health status icon rather than the Healthy icon appears, you can click that icon to view the root cause and health analysis. To refresh the report page, click the Refresh icon next to the Healthy icon .
Availability Today The Availability Today area is shown in Figure 12. Figure 12 Availability Today area layout The Availability Today area contains the following fields: • Refresh icon • Availability pie chart—Shows time duration percentages of the availability states for Windows XP today. The availability states include Available, Unavailable, Inaccessible, and Unmanaged. To view the time duration percentage of a specific availability state, place the cursor over the corresponding slice in the chart.
Figure 13 CPU usage dashboard graph Figure 14 CPU usage trend graph The CPU Usage Ratio area contains the following fields: • Dashboard icon /Trend icon —Click the Dashboard icon display the area in a dashboard or trend graph. or Trend icon CPU usage dashboard graph—Shows the transient CPU usage of Windows XP in the last polling period. CPU usage trend graph—Shows the CPU usage trend of Windows XP over a specified time range in a line graph.
graph as dotted lines in different colors: yellow for the level-1 threshold and red for level-2. The CPU usage ratio is highlighted in yellow when it reaches the level-1 threshold, and is highlighted in red when it reaches the level-2 threshold. You can use either the global thresholds or user-defined thresholds. For information about configuring alarm thresholds, see "xxx." History icon —Click the History icon to view statistics of the history CPU usage trend for Windows XP in a line graph.
Figure 16 Memory usage trend graph The Memory Usage Ratio area contains the following fields: • Dashboard icon /Trend icon —Click the Dashboard icon display the area in a dashboard or trend graph. Memory usage trend graph—Shows the memory usage trend of Windows XP over a specified time range in a line graph. The green line represents the physical memory usage, and the orange line represents the virtual memory usage.
Set Threshold icon —Click the Set Threshold icon for a monitor index to set alarm thresholds for the physical or virtual memory usage. The usage ratio is highlighted in yellow when it reaches the level-1 threshold, and is highlighted in red when it reaches the level-2 threshold. You can use either the global thresholds or user-defined thresholds. For information about configuring alarm thresholds, see "xxx.
Response Time—Ping response time in the last ping test. Packets Sent—Number of ICMP packets sent in the last ping test. The maximum value is 3. Packets Received—Number of ICMP responses received by APM in the last ping test. The value can be 0 or 1. History icon —Click the History icon for a monitor index to view trend statistics of the history response time, sent packets, or received packets in a line graph. By default, the graph shows the last hour statistics.
History icon —Click the History icon for a disk to view statistics of the history space usage trend of the disk. By default, the graph shows the last hour statistics. To change the report period, click the Last 6 Hours icon , Today icon , Yesterday icon , This Week icon , This Month icon , or This Year icon on the upper right of the graph as needed.
to monitor. APM starts to collect CPU and memory usages of the selected processes in the next polling interval. The Process area layout is shown in Figure 20. Figure 20 Process area layout The Process area contains the following fields: • Config icon —Click the Config icon . APM quickly populates the Application Instance List with all detected processes running on Windows XP. Select the processes you want to monitor and click OK.
Windows Server Windows Server represents a group of server operating systems. Windows Server provides a base platform for a variety of desktop-oriented applications. To ensure service quality, performance and stability of Windows Server must be guaranteed. APM monitors and displays Windows Server data, from which operators can obtain the latest operation status of the concerned Windows Server hosts. Windows Server that can be monitored includes Windows Server 2003 and Windows Server 2008.
Enable Event Logging—Enable or disable event logging. With this function enabled, APM collects Windows Server event logs recorded by the Windows Event Log service. Username—This field appears only when you select WMI for Monitor Type. Enter the username of the administrator who can manage the host. If the administrator is a domain user, use the domain name\username format. If the administrator is a local user, use the host name\username or IP address\username format, or simply use the username.
Username—This field appears only when you select WMI for Monitor Type. Enter the username of the administrator who can manage the host. If the administrator is a domain user, use the domain name\username format. If the administrator is a local user, use the host name\username or IP address\username format, or simply use the username. 5. Password—This field appears only when you select WMI for Monitor Type. Enter the password of the administrator.
The previous monitor report is for the application monitor named WindowsServer_192.168.20.105. The health status of the Windows Server application is Healthy . If another health status icon rather than the Healthy icon appears, you can click that icon to view the root cause and health analysis. To refresh the report page, click the Refresh icon next to the Healthy icon . The monitor report contains multiple areas, as shown in Figure 22, which are described in the following sections.
Figure 23 Availability Today area layout The Availability Today area contains the following fields: • Refresh icon • Availability pie chart—Shows time duration percentages of the availability states for Windows Server today. The availability states include Available, Unavailable, Inaccessible, and Unmanaged. To view the time duration percentage of a specific availability state, place the cursor over the corresponding slice in the chart.
Figure 24 CPU usage dashboard graph Figure 25 CPU usage trend graph The CPU Usage Ratio area contains the following fields: • Dashboard icon /Trend icon —Click the Dashboard icon display the area in a dashboard or trend graph. CPU usage trend graph—Shows the CPU usage trend of Windows Server over a specified time range in a line graph. Place the cursor over a spot in the curve to view the CPU usage of Windows Server at the specific time point. By default, the graph shows the last hour data.
trend graph as dotted lines in different colors: yellow for the level-1 threshold and red for level-2. The CPU usage ratio is highlighted in yellow when it reaches the level-1 threshold, and is highlighted in red when it reaches the level-2 threshold. You can use either the global thresholds or user-defined thresholds. History icon —Click the History icon to view statistics of the history CPU usage trend for Windows Server in a line graph. By default, the graph shows the last hour statistics.
Figure 27 Memory usage trend graph The Memory Usage Ratio area contains the following fields: • Dashboard icon /Trend icon —Click the Dashboard icon display the area in a dashboard or trend graph. Memory usage trend graph—Shows the memory usage trend of Windows Server over a specified time range in a line graph. The green line represents the physical memory and the orange line represents the virtual memory.
Set Threshold icon —Click the Set Threshold icon for a monitor index to set alarm thresholds for the physical or virtual memory usage. The usage ratio is highlighted in yellow when it reaches the level-1 threshold, and is highlighted in red when it reaches the level-2 threshold. You can use either the global thresholds or user-defined thresholds. History icon —Click the History icon for a monitor index to view statistics of the history physical or virtual memory usage ratios for Windows Server.
Response Time—Ping response time in the last ping test. Packets Sent—Number of ICMP packets sent in the last ping test. The maximum value is 3. Packets Received—Number of ICMP responses received by APM in the last ping test. The value can be 0 or 1. History icon —Click the History icon to view trend statistics of the history response time in a line graph. By default, the graph shows the last hour statistics.
icon , This Month icon , or This Year icon on the upper right of the graph as needed. Hourly data and today's data is collected every polling interval, yesterday's, weekly, and monthly data is collected in hours, and yearly data is collected in days. The statistics graph contains maximum, minimum, and average disk space usage ratios. Place the cursor over a spot in the curve to view disk space usage ratios at the specific time point. • In Use—Used space of the disk. • Free Space—Free space of the disk.
Figure 31 Network Interface area layout The Network Interface area contains the following fields: • Refresh icon • Name—Name of the network interface card (NIC). APM monitors both physical and virtual (or logical) network interface cards. • Bandwidth—Maximum bandwidth of the NIC. • Receive Rate—Receive rate of the NIC in the last polling period. —Click the Refresh icon to refresh the area. Set Threshold icon —Click the Set Threshold icon for a NIC to set receive rate alarm thresholds for it.
• Config icon —Click the Config icon . APM quickly populates the Application Instance List with all detected processes running on Windows Server. Select the processes you want to monitor and click OK. APM starts to collect CPU and memory usages of the selected processes in the next polling interval. • Refresh icon • Process—Name of the process. • Command—Command used to start the process. • CPU Usage Ratio—CPU usage of the process in the last polling period.
Figure 33 Event area layout The Event area contains the following fields: • Refresh icon —Click the Refresh icon • Time—Time when the event occurred. • Module—Module to which the event belongs. • Event ID—ID of the event. • Source—Source of the event. • Type—Type of the event. • Description—Description of the event. • More—Click More to view all events generated on the Windows Server host in a separate window. 63 to refresh the area.
8 UNIX server monitor This section introduces how to monitor a UNIX system and view the monitoring report. APM provides application monitor facility for the following types of UNIX system: • AIX • Solaris • FreeBSD • Mac OS • OpenBSD • HP-UX AIX As a UNIX operation system, the AIX system can be installed on various types of IBM servers. The performance and stability of AIX greatly affect the performance of applications running on it.
• Name—Specify a name for the AIX monitor. The names of the AIX monitors cannot overlap. HP recommends that you name the monitor using the format: application name_host IP. • Description—Input an introduction of the AIX monitor. A detailed description can help administrators with application management. • IP Address—Click Select to open the Device Resource dialog box, and select the host that the AIX resides through IP View, Device View, or Custom View.
Viewing AIX monitoring report After adding an AIX monitor, you can view the evaluation result and related indexes of the monitored AIX system in the monitoring report. To view the monitoring report: 1. Click Resource > Application Management. 2. In the navigation tree, click Application Monitor. All applications monitors are displayed in the Application Monitor page. 3. Click the name of an AIX monitor to open the real-time report of the monitored AIX system.
Figure 34 Monitor information This pane contains the following information: • Name—Indicate the name of the AIX monitor. • Health status—Indicate the current health status of the monitored AIX. • IP Address—Indicate the IP address of the host that the AIX resides. • Application Type—Indicate the type of the monitored application. • Last Polling Time—Indicate the time when APM polls the host that the AIX resides for the last time.
Figure 35 Available today This pane contains the following information: • Pie chart of Availability—Display the percentage of each availability state. Move the pointer over each section of the pie chart to view the percentage of each availability state. • Current Availability—Indicate the availability state of the AIX system when APM polls the host that the AIX resides for the last time. 7-day History—Click the 7-day history icon to view the availability states of the AIX in the past seven days.
Figure 36 AIX CPU usage ratio-Dial Plate Figure 37 AIX CPU usage ratio trend diagram This pane contains the following information: • Dial Plate icon /Trend Diagram —Click the Dial Plate icon to select a display mode of the AIX CPU usage ratio. Dial Plate of CPU Usage Ratio—Display the CUP usage ratio trend of the AIX system when the last time APM polls the host that the AIX system resides.
highlighted in yellow if the conditions of Level-1 threshold are met, and is highlighted in red if the conditions of Level-2 threshold are met. You can set a user-defined threshold or a global threshold to control alarms of the CPU usage ratio. History Record—Click the History Record icon to view the CPU usage ratio trend of the AIX system in a past time period, which includes the last 1 hour, last 6 hours, today, yesterday, this week, this month, and this year.
This pane contains the following information: • Dial Plate icon • /Trend Diagram —Click the Dial Plate icon or the Trend Diagram to select a display mode of the AIX Memory usage ratio. Dial Plate of Memory Usage Ratio—Display the memory usage ratio of the AIX system when APM polls the host that AIX resides for the last time.
yesterday, this week, this month, and this year.
History Record—Click the History Record icon to view the trend of the Ping test indexes in a past time period, which includes the response time, packets sent, packets received indexes. The time periods you can view include the last 1 hour, last 6 hours, today, yesterday, this week, this month, and this year.
Blue curve—Indicate the trend of system load average (system load/15 minutes) in the past hour. Move the pointer to the curve to view the system load average of a specified sampling point. Click the System Load/Min, System Load/5 Min, and System load/15 Min to display or hide the corresponding monitored indexes. • Attribute/Value—Displays the monitored indexes and its value.
Figure 42 File system usage ratio This pane contains the following information: • Bar graph of file system usage ratio—Display the usage ratio of the disk storage space for each mount point when APM polls the host that the AIX resides for the last time. • File System—Indicate the mount points of the AIX file system. • Usage Ratio—Indicate the storage space usage ratio of the specified partition or logical volume.
hour, last 6 hours, today, yesterday, this week, this month, and this year.
1 hour, Last 6 hours, or Today, the packet receiving rate is measured in unit of a polling interval; if you select the time period Yesterday, This week, or This month, the packet receiving rate is measured in hours, and the diagram displays the packet receiving rate trends, and the maximum, minimize, and average values of the packet receiving rate index; if you select the time period This year, the packet receiving rate is measured in days, and the diagram displays the packet receiving rate trend, and the m
Figure 45 Process This pane contains the following information: • Configuration ( )—Click the Configuration icon to search the processes running on the AIX system. Select the processes to be monitored, and then click OK. APM collects the index data for the monitored processes during the next host polling, which includes the CPU usage ratio and memory usage ratio. • Process—Indicate the name of the monitored process.
the memory usage ratio index. Move the pointer over the each sampling point to view the memory usage ratio of the monitored process for the time being. I/O status APM can monitor the I/O status of the disk drivers in the AIX system, as shown in Figure 46. Figure 46 I/O state This pane contains the following information: • Device Name—Indicate the name of the disk drivers in the AIX system. • I/O Rate—Indicate the number of bits of the input/output data in the disk driver per second.
Two ways to open the Add Application page: • Click Resource > Application Management, and then in the navigation tree, click Add Application. • Click Resource > Application Management, and then in the navigation tree, click Application Monitor, the Application Monitor list displays. Click Add to open the Add Application page. 2. Click the Solaris icon page. 3. In the Add-Solaris page, complete the following information: • Name—Specify a name for the Solaris monitor.
2. In the navigation tree, click Application Monitor to open the Application Monitor page. 3. Click the Modify icon appears. 4. Specify the parameters for the Solaris monitor. of the Solaris monitor you want to modify. The Modify-Solaris page For more information, see “Adding an AIX application monitor.” 5. Click OK.
Figure 47 Monitor information This pane contains the following information: • Name—Indicate the name of the Solaris monitor. • Health status—Indicate the current health status of the monitored Solaris. • IP Address—Indicate the IP address of the host that the Solaris resides. • Application Type—Indicate the type of the monitored application. • Last Polling Time—Indicate the time when APM polls the host that the Solaris resides for the last time.
Figure 48 Available today This pane contains the following information: • Pie chart of Availability—Display the percentage of each availability state. Move the pointer over each section of the pie chart to view the percentage of each availability state. Current Availability—Indicate the availability state of the Solaris system when APM polls the host that the Solaris resides for the last time.
CPU usage ratio The CPU Usage Ratio pane is shown in Figure 49 and Figure 50. Figure 49 CPU usage ratio Figure 50 CPU usage ratio trend This pane contains the following information: • Dial Plate icon /Trend Diagram —Click the Dial Plate icon to select a display mode of the Solaris CPU usage ratio. Dial Plate of CPU Usage Ratio—Display the CUP usage ratio trend of the Solaris system when the last time APM polls the host that the Solaris system resides.
Threshold setting—Click the threshold setting icon to set the alarm threshold of CPU usage ratio. The enabled threshold is shown in a dotted line. The CPU usage ratio is highlighted in yellow if the conditions of Level-1 threshold are met, and is highlighted in red if the conditions of Level-2 threshold are met. You can set a user-defined threshold or a global threshold to control alarms of the CPU usage ratio.
Figure 52 Usage ratio trend This pane contains the following information: • Dial Plate icon • /Trend Diagram —Click the Dial Plate icon or the Trend Diagram to select a display mode of the Solaris Memory usage ratio. Dial Plate of Memory Usage Ratio—Display the memory usage ratio of the Solaris system when APM polls the host that Solaris resides for the last time.
days, and the diagram displays the trend of the used memory capacity, and the maximum, minimize, and average value of the used memory capacity. Move the pointer over the each sampling point to view the used memory capacity of the Solaris system for the time being. • Usage Ratio—Indicate the current memory (physical memory or swap memory) usage ratio of the Solaris system.
This pane contains the following information: • Curve graph of Ping test—Display the result trend of the Ping tests in the past one hour by default. You can also select a time period to view the result trend in the specified time period. Click the Last 1 hour icon , the Last 6 hours icon , the Today icon , the Yesterday icon , the This week icon , the This month icon , or the This year icon to select a time period.
Figure 54 System load This pane contains the following information: • Curve graph of system load—Display the trend of the Solaris system load average (system load/1 minutes, system load/5 minutes, and system load/15 minutes) in the past one hour by default. You can also select a time period to view the system load trend in the specified time period.
period This year, the system load indexes are measured in days, and the diagram displays the system load trends, and the maximum, minimize, and average values of the system load indexes. Move the pointer over the each sampling point to view the system load for the time being. File system usage ratio Being different from the Windows file system, the Solaris file system has only one root directory (/), which contains all sub-directories and files.
Network interface The Network Interface pane is shown in Figure 56. Figure 56 Network interface This pane contains the following information: • Name—Indicate the network card identities of the Solaris system. The network cards that can be monitored by APM include physical network cards and virtual network cards (logical network card). • Receive Rate—Indicate the packet receiving rate of the monitored network card when APM polls the host that the Solaris resides for the last time.
Figure 57 Process This pane contains the following information: • Configuration ( )—Click the Configuration icon to search the processes running on the Solaris system. Select the processes to be monitored, and then click OK. APM collects the index data for the monitored processes during the next host polling, which includes the CPU usage ratio and memory usage ratio. • Process—Indicate the name of the monitored process.
displays the memory usage ratio trend, and the maximum, minimize, and average values of the memory usage ratio index. Move the pointer over the each sampling point to view the memory usage ratio of the monitored process for the time being. I/O status APM can monitor the I/O status of the disk drivers in the Solaris system, as shown in Figure 58. Figure 58 I/O state This pane contains the following information: • Device Name—Indicate the name of the disk drivers in the Solaris system.
• Click Resource > Application Management, and then in the navigation tree, click Add Application. • Click Resource > Application Management, and then in the navigation tree, click Application Monitor, the Application Monitor list displays. Click Add to open the Add Application page. 2. Click the FreeBSD icon Add-FreeBSD page. 3. In the Add-FreeBSD page, complete the following information: • Name—Specify a name for the FreeBSD monitor. The names of the FreeBSD monitors cannot overlap.
of the FreeBSD monitor you want to modify. The Modify-FreeBSD 3. Click the Modify icon page appears. 4. Specify the parameters for the FreeBSD monitor. For more information, see “Adding a FreeBSD application monitor.” 5. Click OK. Viewing FreeBSD monitoring report After adding a FreeBSD monitor, you can view the evaluation result and related monitored indexes of the monitored FreeBSD system in the monitoring report. To view the monitoring report: 1. Click Resource > Application Management. 2.
Figure 59 Monitor information This pane contains the following information: • Name—Indicate the name of the FreeBSD monitor. • Health status—Indicate the current health status of the monitored FreeBSD. • IP Address—Indicate the IP address of the host that the FreeBSD resides. • Application Type—Indicate the type of the monitored application. • Last Polling Time—Indicate the time when APM polls the host that the FreeBSD resides for the last time.
Figure 60 Available today This pane contains the following information: • Pie chart of Availability—Display the percentage of each availability state. Move the pointer over each section of the pie chart to view the percentage of each availability state. • Current Availability—Indicate the availability state of the FreeBSD system when APM polls the host that the FreeBSD resides for the last time.
Figure 61 CPU usage ratio Figure 62 CPU usage ratio trend This pane contains the following information: • Dial Plate icon /Trend Diagram —Click the Dial Plate icon or the Trend Diagram to select a display mode of the FreeBSD CPU usage ratio. Dial Plate of CPU Usage Ratio—Display the CUP usage ratio trend of the FreeBSD system when the last time APM polls the host that the FreeBSD system resides.
highlighted in yellow if the conditions of Level-1 threshold are met, and is highlighted in red if the conditions of Level-2 threshold are met. You can set a user-defined threshold or a global threshold to control alarms of the CPU usage ratio. History Record—Click the History Record icon to view the CPU usage ratio trend of the FreeBSD system in a past time period, which includes the last 1 hour, last 6 hours, today, yesterday, this week, this month, and this year.
Figure 64 Usage ratio trend This pane contains the following information: • Dial Plate icon • /Trend Diagram —Click the Dial Plate icon or the Trend Diagram to select a display mode of the FreeBSD Memory usage ratio. Dial Plate of Memory Usage Ratio—Display the memory usage ratio of the FreeBSD system when APM polls the host that FreeBSD resides for the last time.
used memory capacity of the FreeBSD system is measured in days, and the diagram displays the trend of the used memory capacity, and the maximum, minimize, and average value of the used memory capacity. Move the pointer over the each sampling point to view the used memory capacity of the FreeBSD system for the time being. • Usage Ratio—Indicate the current memory (physical memory or swap memory) usage ratio of the FreeBSD system.
Figure 65 Ping test This pane contains the following information: • Curve graph of Ping test—Display the result trend of the Ping tests in the past one hour by default. You can also select a time period to view the result trend in the specified time period. Click the Last 1 hour icon , the Last 6 hours icon , the Today icon , the Yesterday icon , the This week icon , the This month icon , or the This year icon to select a time period.
The System Load pane is shown in Figure 66. Figure 66 System load This pane contains the following information: • Curve graph of system load—Display the trend of the FreeBSD system load average (system load/1 minutes, system load/5 minutes, and system load/15 minutes) in the past one hour by default. You can also select a time period to view the system load trend in the specified time period.
maximum, minimize, and average values of the system load indexes; if you select the time period This year, the system load indexes are measured in days, and the diagram displays the system load trends, and the maximum, minimize, and average values of the system load indexes. Move the pointer over the each sampling point to view the system load for the time being.
space usage ratio index; if you select the time period This year, the storage space usage index is measured in days, and the diagram displays the storage space usage ratio trend, and the maximum, minimize, and average values of the storage space usage ratio index. Move the pointer over the each sampling point to view the storage space usage ratio for the time being. • In Use—Indicate the used storage space of the specified partition or logical volume.
diagram displays the packet receiving rate trend, and the maximum, minimize, and average values of the packet receiving rate index. Move the pointer over the each sampling point to view the packet receiving rate for the time being. • Send Rate—Indicate the packet sending rate of the monitored network card when APM polls the host that the FreeBSD resides for the last time.
Level-2 threshold are met. You can set a user-defined threshold or a global threshold to control alarms of CPU usage ratio. • History Record—Click the History Record icon to CPU usage ratio trend of the monitored process in a past time period, which includes the last 1 hour, last 6 hours, today, yesterday, this week, this month, and this year.
APM can monitor the Mac OS X Server 10.1.5 or latter version. Configuring Mac OS monitor APM can monitor Mac OS operation system using CLI or SNMP mode. Before starting Mac OS monitor configuration on APM, make sure that the following conditions are meet: • The Mac OS operation system to be monitored starts up, and the Telnet/SSH or SNMP is enabled. For more information, see the Mac OS configuration guide. • The host on which Mac OS resides has been added to the IMC base platform.
• Related Applications—Click Add to open the Select Application dialog, and select the Mac OS related applications, and then click OK. The operators can view the applications related to the Mac OS in the application topology. NOTE: You cannot select the applications of in the operation system catalogues when you select the related applications for the Mac OS, which includes the applications in the Windows XP, Windows Server, AIX, FreeBSD, OpenBSD, HP-UX, Solaris, Mac OS, and Linux catalogues.
To refresh the Mac OS monitoring report: Click the refresh icon on the top of the monitoring report. To refresh each pane of the Mac OS monitoring report: Click the refresh icon on the top of each pane to view the corresponding latest monitoring data.
• Top5 unrecovered alarm—Displays the top5 unrecovered alarms generated by the Mac OS system. The alarm levels include: Minor alarm—Highlighted in yellow. Major alarm—Highlighted in orange. Critical alarm—Highlighted in red. Availability today The Availability Today pane is shown in Figure 72. Figure 72 Available today This pane contains the following information: • Pie chart of Availability—Display the percentage of each availability state.
NOTE: The availability state for which the cumulative time is 0 does not display in this pane. For a new-added Mac OS monitor, APM start counting the cumulative time of each availability state from the time when the Mac OS monitor is added successfully. CPU usage ratio The CPU Usage Ratio pane is shown in Figure 73 and Figure 74.
specified time period. Click the Last 1 hour icon , the Yesterday icon icon • , the This week icon , the Last 6 hours icon , the Today icon , the This month icon , or the This year to select a time period. CPU Usage Ratio—Indicate the current CPU usage ratio of the Mac OS system. Threshold setting—Click the threshold setting icon to set the alarm threshold of CPU usage ratio. The enabled threshold is shown in a dotted line.
Figure 76 Usage ratio trend This pane contains the following information: • Dial Plate icon —Click the Dial Plate icon or the Trend Diagram to select a display mode of the Mac OS Memory usage ratio. Dial Plate of Memory Usage Ratio—Display the memory usage ratio of the Mac OS when APM polls the host that Mac OS resides for the last time.
capacity. Move the pointer over the each sampling point to view the used memory capacity of the Mac OS for the time being. • Usage Ratio—Indicate the current memory (physical memory or swap memory) usage ratio of the Mac OS system. Formula: Usage Ratio=In Use/Total * 100% Threshold setting—Click the threshold setting icon to set the alarm threshold of memory (physical memory or swap memory) usage ratio. The enabled threshold is shown in a dotted line.
• Curve graph of Ping test—Display the result trend of the Ping tests in the past one hour by default. You can also select a time period to view the result trend in the specified time period. Click the Last 1 hour icon , the Last 6 hours icon , the Today icon , the Yesterday icon , the This Week icon , the This Month icon , or the This Year icon to select a time period. Move the pointer to the curve to view the Ping response time of a specified sampling point.
This pane contains the following information: • Curve graph of system load—Display the trend of the Mac OS system load average (system load/1 minutes, system load/5 minutes, and system load/15 minutes) in the past one hour by default. You can also select a time period to view the system load trend in the specified time period.
Figure 79 File system usage ratio This pane contains the following information: • Bar graph of file system usage ratio—Display the usage ratio of the disk storage space for each mount point when APM polls the host that the Mac OS resides for the last time. • File System—Indicate the mount points of the Mac OS file system. • Usage Ratio—Indicate the storage space usage ratio of the specified partition or logical volume.
Network interface The Network Interface pane is shown in Figure 80. Figure 80 Network interface This pane contains the following information: • Name—Indicate the network card identities of the Mac OS system. The network cards that can be monitored by APM include physical network cards and virtual network cards (logical network card). • Receive Rate—Indicate the packet receiving rate of the monitored network card when APM polls the host that the Mac OS resides for the last time.
Figure 81 Process This pane contains the following information: • Configuration ( )—Click the Configuration icon to search the processes running on the Mac OS. Select the processes to be monitored, and then click OK. APM collects the index data for the monitored processes during the next host polling, which includes the CPU usage ratio and memory usage ratio. • Process—Indicate the name of the monitored process.
yesterday, this week, this month, and this year.
1. Open the Add Application page. Two ways to open the Add Application page: • Click Resource > Application Management, and then in the navigation tree, click Add Application. • Click Resource > Application Management, and then in the navigation tree, click Application Monitor, the Application Monitor list displays. Click Add to open the Add Application page. 2. Click the OpenBSD icon Add-OpenBSD page. 3.
1. Click Resource > Application Management. 2. In the navigation tree, click Application Monitor to open the Application Monitor page. 3. Click the Modify icon of the OpenBSD monitor you want to modify. The Modify-OpenBSD page appears. 4. Specify the parameters for the OpenBSD monitor. For more information, see “Adding an OpenBSD application monitor.” 5. Click OK.
Figure 83 Monitor information This pane contains the following information: • Name—Indicate the name of the OpenBSD monitor. • Health status—Indicate the current health status of the monitored OpenBSD. • IP Address—Indicate the IP address of the host that the OpenBSD resides. • Application Type—Indicate the type of the monitored application. • Last Polling Time—Indicate the time when APM polls the host that the OpenBSD resides for the last time.
This pane contains the following information: • Pie chart of Availability—Display the percentage of each availability state. Move the pointer over each section of the pie chart to view the percentage of each availability state. • Current Availability—Indicate the availability state of the OpenBSD system when APM polls the host that the OpenBSD resides for the last time. 7-day History—Click the 7-day history icon to view the availability states of the OpenBSD in the past seven days.
Figure 86 CPU usage ratio trend This pane contains the following information: • Dial Plate icon /Trend Diagram —Click the Dial Plate icon or the Trend Diagram to select a display mode of the OpenBSD CPU usage ratio. Dial Plate of CPU Usage Ratio—Display the CUP usage ratio trend of the OpenBSD system when the last time APM polls the host that the OpenBSD resides. Curve graph of CPU usage ratio trend—Display the CPU usage ratio trend of the OpenBSD over a certain time period.
Memory Usage ratio The Memory Usage Ratio pane is shown in Figure 87 and Figure 88. Figure 87 Memory Usage ratio Figure 88 Usage ratio trend This pane contains the following information: • Dial Plate icon /Trend Diagram —Click the Dial Plate icon or the Trend Diagram to select a display mode of the OpenBSD Memory usage ratio. Dial Plate of Memory Usage Ratio—Display the memory usage ratio of the OpenBSD when APM polls the host that OpenBSD resides for the last time.
a time period to view the memory usage ratio trend in the specified time period. Click the Last 1 hour icon week icon • , the Last 6 hours icon , the This month icon , the Today icon , the Yesterday icon , or the This year icon , the This to select a time period. Item—Indicate the memory usage ratio indexes for the OpenBSD application monitor, including: Physical Memory—Indicate the physical memory of the OpenBSD system. Swap—Indicate the swap memory of the OpenBSD system.
Ping test At the beginning of a host polling, APM starts a Ping test for the host that the OpenBSD resides. During a Ping test, APM sends ICMP packets to the host, and receives the response from the host. Once receiving a response, which means that the Ping test is successful, APM records the time when receiving the response. Otherwise, APM will try up to three times to Ping test the host. The Ping Test pane is shown in Figure 89.
Ping test indexes, and the maximum, minimize, and average values of the indexes. Move the pointer over the each sampling point to view the Ping test result for the time being. System load APM can analyze and display the system load average for the monitored OpenBSD in the specified time period (one minute, five minutes, and fifteen minutes). System load average is the average number of the processes running on the OpenBSD system during a specified time period.
System Load/15 Min—Indicate the system load average of the last fifteen minutes before APM start polling the host. History Record—Click the History Record icon to view the system load trend of the OpenBSD system in a past time period, which includes the last 1 hour, last 6 hours, today, yesterday, this week, this month, and this year.
• Bar graph of file system usage ratio—Display the usage ratio of the disk storage space for each mount point when APM polls the host that the OpenBSD resides for the last time. • File System—Indicate the mount points of the OpenBSD file system. • Usage Ratio—Indicate the storage space usage ratio of the specified partition or logical volume.
of Level-2 threshold are met. You can set a user-defined threshold or a global threshold to control alarms of the packet receiving rate. History Record—Click the History Record icon to view the packet receiving rate trend of the monitored network card in a past time period, which includes the last 1 hour, last 6 hours, today, yesterday, this week, this month, and this year.
• CPU Usage Ratio—Indicate the CPU usage ratio of the monitored process when APM polls the host that the OpenBSD resides for the last time. • Threshold setting—Click the threshold setting icon to set the threshold of CPU usage ratio for the monitored process. The indexes of the monitored process is highlighted in yellow if the conditions of Level-1 threshold are met, and is highlighted in red if the conditions of Level-2 threshold are met.
HP-UX HP-UX is a UNIX operation system, of which the performance and stability can greatly affect the performance of applications or services running on it. Therefore, APM provides the ability to monitor HP-UX. APM can monitor the HP-UX 11.00 or latter version. Configuring HP-UX monitor APM can monitor HP-UX operation system using CLI mode.
• Contact—Input information of the contacts related to the HP-UX system, such as name, phone number, email address, and so forth. • Related Applications—Click Add to open the Select Application page, and select the HP-UX related applications, and then click OK. The operators can view the applications related to the HP-UX system in the application topology.
Click the analysis icon the unhealthy state. on the top of the monitoring report to view the potential factors that cause To refresh the HP-UX monitoring report: Click the refresh icon on the top of the monitoring report. To refresh each pane of the HP-UX monitoring report: Click the refresh icon on the top of each pane to view the corresponding latest monitoring data.
If there are alarms that are generated by HP-UX and have not been recovered, this pane also displays the following information: • Top5 unrecovered alarm—Displays the top5 unrecovered alarms generated by the HP-UX system. The alarm levels include: Minor alarm—Highlighted in yellow. Major alarm—Highlighted in orange. Critical alarm—Highlighted in red. Availability today The Availability Today pane is shown in Figure 96.
NOTE: The availability state for which the cumulative time is 0 does not display in this pane. For a new-added HP-UX monitor, APM start counting the cumulative time of each availability state from the time when the HP-UX monitor is added successfully. CPU usage ratio The CPU Usage Ratio pane is shown in Figure 97 and Figure 98.
in the past one hour by default. You can also select a time period to view the CPU usage ratio trend in the specified time period. Click the Last 1 hour icon Today icon This year icon • , the Yesterday icon , the This week icon , the Last 6 hours icon , the This month icon , the , or the to select a time period. CPU Usage Ratio—Indicate the current CPU usage ratio of the HP-UX system. Threshold setting—Click the threshold setting icon to set the alarm threshold of CPU usage ratio.
Figure 100 Usage ratio trend This pane contains the following information: • Dial Plate icon • /Trend Diagram —Click the Dial Plate icon or the Trend Diagram to select a display mode of the HP-UX Memory usage ratio. Dial Plate of Memory Usage Ratio—Display the memory usage ratio of the HP-UX system when APM polls the host that HP-UX resides for the last time.
memory capacity of the HP-UX system is measured in days, and the diagram displays the trend of the used memory capacity, and the maximum, minimize, and average value of the used memory capacity. Move the pointer over the each sampling point to view the used memory capacity of the HP-UX system for the time being. • Usage Ratio—Indicate the current memory (physical memory or swap memory) usage ratio of the HP-UX system.
Figure 101 Ping test This pane contains the following information: • Curve graph of Ping test—Display the result trend of the Ping tests in the past one hour by default. You can also select a time period to view the result trend in the specified time period. Click the Last 1 hour icon , the Last 6 hours icon , the Today icon , the Yesterday icon , the This Week icon , the This Month icon , or the This Year icon to select a time period.
Figure 102 System load This pane contains the following information: • Curve graph of system load—Display the trend of the HP-UX system load average (system load/1 minutes, system load/5 minutes, and system load/15 minutes) in the past one hour by default. You can also select a time period to view the system load trend in the specified time period.
period This year, the system load indexes are measured in days, and the diagram displays the system load trends, and the maximum, minimize, and average values of the system load indexes. Move the pointer over the each sampling point to view the system load for the time being. File system usage ratio Being different from the Windows file system, the HP-UX file system has only one root directory (/), which contains all sub-directories and files.
Last 6 hours, or Today, the storage space usage ratio index is measured in unit of a polling interval; if you select the time period Yesterday, This week, or This month, the storage space usage ratio index is measured in hours, and the diagram displays the storage space usage ratio trends, and the maximum, minimize, and average values of the storage space usage ratio index; if you select the time period This year, the storage space usage index is measured in days, and the diagram displays the storage space
Error log APM can check the HP-UX error logs when polling the HP-UX system, and displays the error logs in the HP-UX monitoring report. In the Error Log pane, you can view the latest 10 error logs. The Error Log pane is shown in Figure 105. Figure 105 Error log This pane contains the following information: • Time—Indicate the time when the error occurs. • Log—Indicate the content of the error log. • More—Click the link More to open a window to view more error logs in the HP-UX system.
Figure 106 Process This pane contains the following information: • Configuration ( )—Click the Configuration icon to search the processes running on the HP-UX system. Select the processes to be monitored, and then click OK. APM collects the index data for the monitored processes during the next host polling, which includes the CPU usage ratio and memory usage ratio. • Process—Indicate the name of the monitored process.
History Record—Click the History Record icon to memory usage ratio trend of the monitored process in a past time period, which includes the last 1 hour, last 6 hours, today, yesterday, this week, this month, and this year.
Linux server monitor This chapter describes how to add and modify the Linux application monitor, and helps you view the monitor report. Linux Linux is a popular open source operating system that has multiple release versions. Monitoring Linux is necessary because the operating performance of a Linux server affects network applications on the system. APM can monitor the Linux release versions of Ubuntu, RedHat, SUSE, and Center OS.
5. Polling Interval (min)—Select a polling interval for the application monitor. Available options include 1, 2, 3, 4, 5, 10, 20, and 30. The default polling interval is 5 minutes. A shorter polling interval provides more accurate real-time data, but requires higher performance. Monitor Type—Select a monitor type for the application monitor. Available options include CLI and SNMP. Contact—Enter the contact information, such as name, email address, and telephone number.
applications in the Related Applications box and click Delete. You cannot select operating system applications, such as Windows XP, Windows Server, AIX, FreeBSD, OpenBSD, HP-UX, Solaris, Mac OS, and Linux. You can view the dependencies between applications in a topology view. 5. Detect Application—Enable or disable application detection.
Monitor Information Figure 109 Monitor Information area layout The Monitor Information area contains the following fields: • Refresh icon —Click the Refresh icon to refresh the area. • Name—Application monitor name. • Health State—Health status of the Linux application. • IP Address—IP address of the Linux host. • Application Type—Type of the application, which is always Linux. • Last Polling Time—Time when APM last polled the Linux application.
The Availability Today area contains the following fields: • Refresh icon • Availability pie chart—Shows time duration percentages of the availability states for the Linux application today. The availability states include Available, Unavailable, Inaccessible, and Unmanaged. To view the time duration percentage of a specific availability state, place the cursor over the corresponding slice in the chart. • Current Availability—Availability of the Linux application in the last polling period.
Figure 112 CPU Usage Ratio—Trend graph area layout The CPU Usage Ratio area contains the following fields: • Refresh icon • Dashboard icon /Trend icon view the CPU usage ratio. • —Click the Refresh icon to refresh the area. —Click the Dashboard icon Dashboard icon —Click the Dashboard icon APM polling period. or the Trend icon to to view the CPU usage ratio in the last Trend icon —Click the Trend icon to view the changes of the CPU usage ratio for the Linux application in a line chart.
Figure 113 Memory Usage Ratio—Dashboard area layout Figure 114 Memory Usage Ratio—Trend graph area layout The Memory Usage Ratio area contains the following fields: • Refresh icon • Dashboard icon /Trend icon view the memory usage ratio. —Click the Refresh icon to refresh the area. —Click the Dashboard icon Dashboard icon —Click the Dashboard icon last APM polling period.
This Year icon . Click the legend names of the different types of memory usage ratio to display or hide the corresponding monitor indexes. • Item—Monitor index name. Physical memory—Physical memory of Linux. Swap—Swap memory of Linux. • Total—Total amount of the physical or swap memory. • In Use—Amount of the physical or swap memory in use. • History icon —Click the History icon to view the history graph of the memory usage trend.
Figure 115 Ping Test area layout The Ping Test area contains the following fields: • Refresh icon • Last 1 hour icon —By default, the response time trend graph shows changes of the ping response time over the last one hour. To change the report period, click the Last 1 hour icon on the upper right of the graph, and then select an icon from the list. Available options include Last 6 hours , Today , Yesterday , This Week , This Month , and This Year .
The System Load area layout is shown in Figure 116. Figure 116 System Load area layout The System Load area contains the following fields: • Refresh icon • Last 1 hour icon —By default, the response time trend graph shows changes of the system load over the last one hour. To change the report period, click the Last 1 hour icon on the upper right of the graph, and then select an icon from the list. Available options include Last 6 hours , Today , Yesterday , This Week , This Month , and This Year .
File System Usage Ratio The Linux file system has only one root directory. All file systems appear as subdirectories under the root directory. Each physical disk partition or logical volume can be mounted to a subdirectory. You can read data from or write data to physical disk partitions or logical volumes in the relevant subdirectories. The File System Usage Ratio area layout is shown in Figure 117.
Figure 118 Network Interface area layout The Network Interface area contains the following fields: • Refresh icon • Name—Identifier of a network interface card in Linux. APM monitors physical and virtual (logical) network interface cards. • Receive Rate—Receive rate of a network interface card in the last APM polling period. —Click the Refresh icon to refresh the area.
Figure 119 Error Log area layout The Error Log area contains the following fields: • Refresh icon —Click the Refresh icon • Time—Time when the error occurs. • Log—Content of the error log. • More—Click More to view all error logs. to refresh the area. Process The process list is empty by default. Click the Config icon on the upper right of the graph to configure the process you want to monitor. APM then collects the CPU usage ratio and the memory usage ratio for the process in the next polling.
• Config icon window. • Process—Name of the monitored process. For processes with the same name but different PIDs, APM collects the CPU usage ratio and the memory usage ratio for each process. For example, Apache may generate a lot of httpd processes. If you select httpd processes to monitor, APM collects the CPU usage ratio and the memory usage ratio for each httpd process. • CPU Usage Ratio—CPU usage ratio of the process in the last APM polling period.
• Device Name—Name of the disk, partition, or logical volume in Linux. • I/O Read Rate—Data output rate of disks, partitions, or logical volumes in Linux. • I/O Write Rate—Data input rate of disks, partitions, or logical volumes in Linux.
Database Server Monitor The database server monitors include the following application types: • SQL Server • MySQL • Oracle This chapter introduces you how to add an application monitor and check the details of the corresponding monitor report. SQL Server SQL Server is a Database Management System (DBMS) developed by Microsoft.
8. In the Polling Interval (min) drop list, select the polling query time interval, the unit is min. The selected time interval includes: 1, 2,3,4,5,10,20,30. The shorter polling interval is, more accurate the application running status will reflect. But this brings more workload for the APM server. 9. The authentication on mode when the operator login the SQL Server should be SQL Server Authentication and it is unavailable to be modified. 10.
accurate the application running status will reflect. But this brings more workload for the APM server. 8. Modify the service port of the SQL Server in the Port textbox, which the default value is 1433. 9. When you login in SQL Server, the mode of authentication on should be SQL Server authentication, which cannot be modified. 10. If you want to modify the administrator’ username and password, type in new username and password in the text box. 11.
Figure 122 SQL Server Application Monitor Report (Part) • The name of the application monitor is MSSQL_192.168.0.231. • The current health status of SQL Server is Healthy( ). When the current health status shows Unhealthy, you can click the Healthy icon to view the warning detail and reasons analysis. • Click the Refresh icon on the top of the page to renew the current report data.
Figure 123 Monitor Information-SQL Server • Fresh—Click the Fresh icon to update the detail. • Name—Indicate the names of the application monitor. • Health Status—Indicate the current health status of SQL Server. • IP Address—Indicate the IP address of SQL Server. • Application Type—Indicate the type of the application, SQL Server. • Version—Indicate the version of SQL Server. • Port—Indicate the service port of SQL Server.
Figure 124 Availability today-SQL Server • Fresh—Click the Fresh icon • Availability Pie Chart—Specify the availability percentage comparison for SQL Server. Put the mouse on the fragments of the pie chart to view the percentage for the different alarms. • Current Availability—Specify the availability of SQL Server, the data comes from the last Polling. to fresh the detail. Click the “7 days history” icon to view the SQL Server’s availability of the last 7 days.
Figure 125 Memory usage-SQL Server • Fresh—Click the Fresh Icon to update the detail. • The curve graph displays the memory usage ratio trend of the SQL Server in the past one hour by default. You can also select a time period to view the memory usage ratio trend in the specified time period. Click the Last 1 hour icon Yesterday icon , the This week icon select a time period.
Granted Work space Memory — Specify the granted work space memory for hashing ordering, copying, index creation operations when APM did the last polling in SQL Server. Memory Grants Pending—Specify the memory grant numbers when the SQL Server progress is pending for getting the workspace.. Memory Grants Outstanding—Specify the memory grant numbers when the SQL Server progress is successful to getting the workspace.
period. Click the Last 1 hour icon icon , the This week icon period. , the Last 6 hours icon , the This month icon , the Today icon , or the This year icon , the Yesterday to select a time • Buffer Management—This chart displays the variation of the SQL Server Buffer Hit ratio in the last hour. Put the mouse on the curve to view the specific data of all collection points. • Attribute and Value—Specify the name and data of the memory index.
Figure 127 Connection statistics-SQL Server • Fresh—Click the Fresh icon to update the detail. • The curve graph displays the connection time trend of the SQL Server in the past one hour by default. You can also select a time period to view the connection time trend in the specified time period. Click the Last 1 hour icon icon , the This week icon period.
time period Yesterday, This week, or This month, the connection time of the SQL Server is measured in hours, and the diagram displays the connection time trend, and the maximum, minimize, and average connection time of the SQL Server; if you select the time period This year, the connection time of the SQL Server is measured in days, and the diagram displays the connection time trend, and the maximum, minimize, and average connection time of the SQL Server.
Click the “threshold value setting” icon to set the warning threshold value for cache hit ratio. After this operation, the threshold value is shown as dashed line in the cache hit ratio area. Yellow color stands for the Level 1 threshold value. Red color stands for the Level 2 threshold value. When it meets the level 1 threshold value warning condition, the yellow light displays; when it meets the level 2 threshold value warning condition, the red light displays.
• • Lock Details—This chart displays the variation trend of Lock Waits/sec, Lock Timeouts/sec and Number of Deadlocks/sec in last one hour. Green color stands for Lock Waits/sec. Orange color stands for Lock Timeouts/sec. Blue color stands for Number of Deadlocks/sec. Put the mouse on the curve to view the specific data of all collection points. Click the icon name to display/hide the corresponding index. Attribute and Value—Indicate the name and date of the monitor indexes.
Figure 130 SQL statistics-SQL Server • Fresh—Click the Fresh icon to update the detail. • The curve graph displays the SQL statistics trend of the SQL Server in the past one hour by default. You can also select a SQL statistics time period to view the SQL statistics trend in the specified time period. Click the Last 1 hour icon icon , the This week icon period.
Auto Parameter Failures/Min—Indicate the times of Auto parameter failures per minute when APM did the last polling. The value should be small. History Record—Click the History Record icon to view the SQL statistics trend in a past time period, which includes the last 1 hour, last 6 hours, today, yesterday, this week, this month, and this year.
Average Latch Wait Time—Indicate the polling, the unit is micro second. average latch wait time when APM did the last History Record—Click the History Record icon to view the Latch details trend in a past time period, which includes the last 1 hour, last 6 hours, today, yesterday, this week, this month, and this year.
• Attribute and Value—Indicate the name and data of the indexes. The indexes include: Full Scans/Min—Indicate the times of full scan without limitation per minute, when APM did the last polling. This scan can base on the table or full content scan. Range Scans/Min—Indicate the scan number of limited range by indexing in per minute, when APM did the last polling.
Figure 134 Database details-SQL Server • Fresh—Click the Fresh icon • Database—Indicate the name of the database when APM did last polling. Total stands for the whole statistic for all the databases. • Size—Indicate the size of the database in disk space. • Transaction—Indicate the number of transaction per minute in database. • Active Transaction—Indicate the number of the active transaction in database. • Log File—Indicate the size of the log file of database.
MySQL MySQL is an open source database management system. As one of the important part, the performance can impact the service directly; APM supports the monitor to MySQL. APM can monitor MySQL 5.x.This chapter specify on how to add/modify the MySQL application monitor and MySQL application monitor report. Adding a MySQL application monitor APM monitors the MySQL by server port (default value is 3306).
NOTE: You cannot select the applications of the operation system catalogues when you select the related applications for the MySQL Server, which includes the applications in the Windows XP, Windows Server, AIX, FreeBSD, OpenBSD, HP-UX, Solaris, Mac OS, and Linux catalogues. 12. Tick or not in the textbox to select whether or not to Detect Application. If you select to detect application, APM will connect the application and get the data according to the parameters.
12. Tick or not in the textbox to select whether or not to Detect Application. If you select to detect application, APM will connect the application and get the data according to the parameters. If the connection is successful, the application will add the application monitor successfully, otherwise not. If you don’t select to detect application, the application monitor can be added directly without connecting with the application. 13. Click OK button.
Key Details Buffer Details SQL Statistics Database Details Monitor information The Monitor Information is shown as Figure 136. Figure 136 Monitor information-MySQL • Fresh—Click the Fresh icon to update the detail. • Name—Indicate the names of the application monitor. • Health Status—Indicate the current health status of MySQL. • IP Address—Indicate the IP address of MySQL. • Application Type—Indicate the type of the application, MySQL. • Version—Indicate the version of MySQL.
Availability today The Availability Today information is shown as Figure 137. Figure 137 Availability today-MySQL • Fresh—Click the Fresh • Availability Today—Specify the availability percentage comparison for MySQL. Put the mouse on the fragment of the pie chart to view the percentage for the different alarms. • Current availability—Specify the availability of MySQL, the data comes from the last Polling. icon to update the detail.
Figure 138 Response time-MySQL • Fresh—Click the Fresh icon to update the detail. • The curve graph displays the memory usage ratio trend of the MySQL in the past one hour by default. You can also select a time period to view the memory usage ratio trend in the specified time period. Click the Last 1 hour icon Yesterday icon , the This week icon select a time period.
Figure 139 Request statistics-MySQL • Fresh—Click the Fresh icon • The curve graph displays the request statistics trend of the MySQL in the past one hour by default. You can also select a time period to view the request statistics trend in the specified time period. Click the Last 1 hour icon , the This week icon to update the detail. , the Last 6 hours icon , the This month icon , the Today icon , or the This year icon , the Yesterday icon to select a time period.
request statistics of the MySQL. Move the pointer over the each sampling point to view the request statistics of the MySQL for the time being. Connection statistics The Connection Statistics are shown as Figure 140. Figure 140 Connection statistics-MySQL • Fresh—Click the Fresh icon to update the detail • The curve graph displays the connection statistics trend of the MySQL in the past one hour by default.
hours, or Today, the connection statistics of the MySQL is measured in unit of a polling interval; if you select the time period Yesterday, This week, or This month, the connection statistics of the MySQL is measured in hours, and the diagram displays the connection statistics related index trend, and the maximum, minimize, and average connection statistics of the MySQL; if you select the time period This year, the connection statistics of the MySQL is measured in days, and the diagram displays the connecti
week, this month, and this year.
History Record—Click the History Record icon to view the key details related index trend in a past time period, which includes the last 1 hour, last 6 hours, today, yesterday, this week, this month, and this year.
when it meets the level 2 threshold value warning condition, the red light displays. You can use the custom threshold or global threshold to set the threshold value. Pay more attention that the higher the hit ratio index is, the performance is better, so the threshold condition ought to be set to “Less than or equal to.
Lock Immediately—Indicate the number of the table lock which can be released immediately in MySQL when APM did the last polling. Lock Wait—Indicate the number of the waiting locks when APM did the last polling. History Record—Click the History Record icon to view the table lock statistics related index trend in a past time period, which includes the last 1 hour, last 6 hours, today, yesterday, this week, this month, and this year.
• Click the icon name to display/hide the corresponding index. Attribute and Value—Indicate the name and date of the monitor indexes. The indexes include: Delete—APM statistics the number of the Delete command lines which are operating per minute. Insert—APM statistics the number of the Insert command lines which are operating per minute. Select—APM statistics the number of the Select SQL command lines which are operating per minute.
Oracle Oracle is one of the database management system developed by Oracle Company. As one of the important parts of the service, the performance and stability can impact the service applications directly, so APM supports the monitor function to Oracle. APM can monitor Oracle 8.x,9i,10g,11g version, and Oracle stand-alone and RAC . This chapter will specify introduce how to add/modify an Oracle application monitor and Oracle application monitor report.
13. Click Add to open the Select Application page, and select a related application, and then click OK. The operators can view the applications related to the Oracle in the application topology. NOTE: You cannot select the applications when you select the related applications for the Oracle, which includes the applications in the Windows XP, Windows Server, AIX, FreeBSD, OpenBSD, HP-UX, Solaris, Mac OS, and Linux catalogues. 14. Tick or not in the textbox to select whether or not to Detect Application.
13. Click Add to open the Select Application page, and select a related application, and then click OK. The operators can view the applications related to the Oracle in the application topology. NOTE: You cannot select the applications when you select the related applications for the Oracle, which includes the applications in the Windows XP, Windows Server, AIX, FreeBSD, OpenBSD, HP-UX, Solaris, Mac OS, and Linux catalogues. 14. Tick or not in the textbox to select whether or not to Detect Application.
Availability Today Database Details Connection Time SGA Status SGA Details Rollback Segment “Tablespace” page includes: Details Status Performance Index “Session” page includes: Session Details Waiting Sessions Monitor information The Monitor Information is shown in Figure 148. Figure 148 Monitor information-Oracle • Fresh—Click the Fresh icon to update the detail. • Name—Indicate the name of application monitor.
• Relationship—Click the Relationship icon to open the Oracle application topology page. The operator can view the relationship between Oracle and the other applications. • Top5 Unrecovered Alarm—The last 5 unrecovered alarm in Oracle. If there is no application for the alarm, it does not display this alarm. The warning colors stand for the levels of the alarms, yellow stands for minor warning, red stands for critical warning and orange stands for major warning.
Database details The Database Details are shown as Figure 150. Figure 150 Database details-Oracle • Fresh—click the Fresh icon • Attribute and Value- Indicate the name and date of the monitor indexes. The indexes include: to update the detail. Creation Time—Indicate the time when Oracle installation is completed. Open Mode—Indicate the current open mode for Oracle. Open Modes include: Read only mode and the Read Write. If you want to modify the open mode, please restart Oracle.
the higher the hit ratio index is, the performance is better, so the threshold condition ought to be set to “Less than or equal to.” History Record—Click the History Record icon to view the database details related index trend in a past time period, which includes the last 1 hour, last 6 hours, today, yesterday, this week, this month, and this year.
higher the hit ratio index is, the performance is better, so the threshold condition ought to be set to “Less than or equal to.” History Record—Click the History Record icon to view the connection time related index trend in a past time period, which includes the last 1 hour, last 6 hours, today, yesterday, this week, this month, and this year.
Free Memory—Indicate the free memory of SGA when APM did the last polling.。 Click the “threshold value setting” icon to set the warning threshold value for SGA state. When it meets the level 1 threshold value warning condition, the yellow light displays; when it meets the level 2 threshold value warning condition, the red light displays. You can use the custom threshold or global threshold to set the threshold value.
Database Buffer—Indicate the size of library cache in the SGA space when APM did the last polling. Dictionary Buffer—Indicate the size of library cache in the SGA space when APM did the last polling. SQL Area—Indicate the size of SQL Area in the SGA space when APM did the last polling. History Record—Click the History Record icon to view the SGA detail related index trend in a past time period, which includes the last 1 hour, last 6 hours, today, yesterday, this week, this month, and this year.
• Max Extent Segment—Indicate the number of the maximum extent segment distribute for rollback segment. • Rollback Segment Get—Indicate the times of getting rollback segment. • Rollback Segment Wait—Indicate the wait times of the rollback segment. • HWM—Indicate the High-water Mark of the rollback segment. HWM stands for the position of the last data module in the current segment. • Shrinks—Indicate the shrink times of the rollback segment. • Wraps—Indicate the warp times of the rollback segment.
• Status—Indicate the status of the table space when APM did the last polling. The status include: ONLINE, OFFLINE, and INVALID. • Free Bytes—Indicate the free space which can be used in the table space when APM did the last polling. • Free Blocks—Indicate the number of the free blocks which can be used in the table space when APM did the last polling. • Reads—Indicate the times of reading of the table space when APM did the last polling.
Figure 158 Details-Oracle • Fresh—Click the Fresh icon to update the detail. • ID—Indicate the ID in details. • Status—Indicate the status when APM is doing the last polling • Computer—Indicate the name of the computer which sets session with Oracle when APM did last polling. • Username—Indicate the user name when it sets session with Oracle. • Elapsed Time—Indicate the time when the session is set during APM did last polling.
Figure 159 Waiting sessions-Oracle • Fresh—Click the Fresh icon • ID—Indicate the ID in the waiting status. • Username— Indicate the user name when it connected session with Oracle. • Description—describe the session which is waiting for or the last waiting event. • Events Occurred—Indicate the total session events when APM did last polling. • Status—Indicate the session waiting status when APM did the last polling. The available status is WAITING and WAITED UNKNOWN TIME.
11 Application server monitor This chapter describes how to add and modify the .NET application monitor, and helps you view the monitor report. .NET server .NET is the Microsoft XML Web services platform. XML Web services allow applications to communicate and share data through the Internet, regardless of operating systems or programming languages. With the Microsoft .NET platform, you can create XML Web services and integrate the services as needed. Adding a .
Contact—Enter the contact information, such as name, email address, and telephone number. Username—Enter the username of the administrator who can manage the host. If the administrator is a domain user, use the domain name\username format. If the administrator is a local user, use the host name\username or IP address\username format, or simply use the username. 5. Password—Enter the password of the administrator. Related Applications—Click Add. The Select Applications window appears.
If the administrator is a local user, use the host name\username or IP address\username format, or simply use the username. 5. Password—Enter the password of the administrator. Related Applications—Click Add. The Select Applications window appears. Select the applications that the .NET server depends on, and click OK. You cannot select operating system applications, such as Windows XP, Windows Server, AIX, FreeBSD, OpenBSD, HP-UX, Solaris, Mac OS, and Linux. To remove dependencies between the .
Monitor Information The Monitor Information area layout is shown in Figure 161. Figure 161 Monitor Information area layout The Monitor Information area contains the following fields: • Refresh icon—Click the Refresh icon to refresh the area. • Name—Application monitor name. • Health State—Health status of the .NET server application. • IP Address—IP address of the .NET server host. • Application Type—Type of the application, which is always .NET Server.
Figure 162 Availability Today area layout The Availability Today area contains the following fields: • Refresh icon • Availability pie chart—Shows time duration percentages of the availability states for the .NET server today. The availability states include Available, Unavailable, Inaccessible, and Unmanaged. To view the time duration percentage of a specific availability state, place the cursor over the corresponding slice in the chart. • Current Availability—Availability of the .
Figure 163 .NET Memory area layout The .NET Memory area contains the following fields: • Last 1 Hour icon —By default, the CPU usage in GC trend graph shows the CPU usage trend of GC over the last one hour. To change the report period, click the Last 1 Hour icon on the upper right of the graph, and then select an icon from the list. Available options include Last 6 Hours , Today , Yesterday , This Week , This Month , and This Year .
Figure 164 .NET Thread area layout The .NET Thread area contains the following fields: • Last 1 Hour icon —By default, the .NET threads trend graph shows the number of .NET threads running on the .NET server over the last one hour. To change the report period, click the Last 1 Hour icon on the upper right of the graph, and then select an icon from the list. Available options include Last 6 Hours , Today , Yesterday , This Week , This Month , and This Year . • Refresh icon • .
default, the graph shows the last hour statistics. To change the report period, click the Last 6 Hours icon , Today icon , Yesterday icon , This Week icon , This Month icon , or This Year icon on the upper right of the graph as needed. Hourly data and today's data is collected every polling interval, yesterday's, weekly, and monthly data is collected in hours, and yearly data is collected in days. The statistics graph contains maximum, minimum, and average values of the monitor index.
JIT Just In Time (JIT) is the .NET framework just in time compiler which converts the Microsoft Intermediate Language (MSIL) to native code on an as needed basis. CPU usage is a major indicator of JIT. The JIT area layout is shown in Figure 166. Figure 166 JIT area layout The JIT area contains the following fields: • Last 1 Hour icon —By default, the CPU usage in JIT trend graph shows the CPU usage trend of JIT over the last one hour.
Figure 167 Security area layout The Security area contains the following fields: • Last 1 Hour icon —By default, the total checks during runtime trend graph shows changes of the total number of runtime Code Access Security (CAS) checks performed by the .NET server over the last one hour. To change the report period, click the Last 1 Hour icon on the upper right of the graph, and then select an icon from the list.
• Waiting Transactions—Number of COM+ transactions that are in waiting or suspended states in the last polling interval. • Errors—Number of errors occurred during processing HTTP requests in the last polling interval, including parser errors, compile errors, and runtime errors. Typically, errors do not occur during normal operation. • Requests—Number of requests received by the Web applications since the .NET server started in the last polling interval.
12 Web server monitor Application type—Web server monitor can monitor the following types of server: • Apache server • IIS server • PHP This chapter describes how to add these types of application monitor and the details of application monitor reports. Apache server As a stable, powerful, open-source Web server, Apache is widely used in the Internet. APM can monitor Apache 2.X.
• Make sure the Apache server is loaded with the status module (mod_status.so). For how to configure the Apache server and make the server load the status module, see Configuring the Apache server. To add an Apache server application monitor: 1. Click the Resource tab. 2. Enter the Add Application page in one of the following ways: Select Application Manager > Add Application from the navigation tree. The page displays all application types that can be monitored by APM. 3.
2. Select Application Manager > Application Monitor from the navigation tree. The application monitor list page displays all application monitors. 3. Click the Modify icon for the Apache server application monitor you want to modify. The page for modifying an Apache server application monitor appears. 4. Modify the following parameters for the application monitor: • Name—Enter the application monitor name, which must be unique in APM.
Figure 169 Part of an Apache server application monitor report The previous monitor report is for the application monitor named Apache_172.8.21.5. The health status of the Apache server is Healthy . If another health status icon rather than the Healthy icon appears, you can click that icon to view the root cause and health analysis. To refresh the report data, click the Refresh icon . The monitor report contains multiple areas, as shown in Figure 170, which are described in the following sections.
• Version–Version of Apache. • Service Uptime—Uptime of the Apache server when APM last polled the Apache server. • Total Bytes—Number of bytes of the page requests received by the Apache server when APM last polled the Apache server. • Total Accesses—Number of page requests received by the Apache server when APM last polled the Apache server. • Last Polling Time—Time when APM last polled the Apache server.
• Available Time—Total available time duration of the Apache server since 00:00 today. • Unavailable Time—Total unavailable time duration of the Apache server since 00:00 today. • Inaccessible Time—Total inaccessible time duration of the Apache server since 00:00 today. • Unmanaged Time—Total unmanaged time duration of the Apache server since 00:00 today. The availability time statistics of a new application monitor are collected since the application monitor was added.
Apache server. When Yesterday, This week, or This month is selected, the request number index data is collected in hours. The statistics include the maximum value, minimum value, and average value for each index. When This Year is selected, the request number index data is collected in days. The statistics include the maximum value, minimum value, and average value for each index. To view the data of a specific sampling point, place the cursor over the sampling point.
Contact—Enter the contact information, such as name, email address, and telephone number. Username/Password—Enter the username and password of the host administrator. If the administrator is a domain user, use the domain name\username format. If the administrator is a local user, use the host name\username or IP address\username format, or simply use the username. 5. Related Application—Click Add. The Select Application window appears.
5. Related Application—Click Add. The Select Application window appears. Select the applications that the IIS server depends on, and click OK. To delete dependent applications of the IIS server, select the applications that you want to delete in the Related Application field, and click Delete to the right of the Related Application field. You can view all the dependent applications of the IIS server in the application topology.
Monitor Information Figure 174 Monitor Information area layout The Monitor Information area contains the following fields: • Refresh icon —Click the Refresh icon to refresh the area. • Name—Application monitor name. • Health State—Health status of the IIS server. • IP Address—IP address of the IIS server. • Application Type—Type of the application, which is always IIS Server. • Service Uptime—Service uptime of the IIS server when APM last polled the IIS server.
Figure 175 Availability Today area layout The Availability Today area contains the following fields: • Refresh icon • Availability pie chart—Shows time duration percentages of the availability states for the IIS server today. The availability states include Available, Unavailable, Inaccessible, and Unmanaged. To view the time duration percentage of a specific availability state, place the cursor over the corresponding slice in the chart.
Figure 176 Connections area layout The Connections area contains the following fields: • Refresh icon • Last 1 hour icon —The per-second connection number trend graph shows the trend of the per-second connection numbers in the last hour by default. To change the report period, click the Last 1 hour icon on the upper right of the graph, and select Last 6 hour , Today , Yesterday , This week , This month , or This year from the list.
Figure 177 HTTP area layout The HTTP area contains the following fields: • Refresh icon —Click the Refresh icon to refresh the area. • Last 1 hour —The HTTP response time trend graph shows the trend of the HTTP response time in the last hour by default. To change the report period, click the Last 1 hour icon , and select Last 6 hour , Today , Yesterday , This week , This month , or This year from the list.
Figure 178 Access Information area layout The Access Information area contains the following fields: • Refresh icon —Click the Refresh icon to refresh the area. • Last 1 hour icon —The receive/send rate trend graph shows the trend of the send/receive rates in the last hour by default. To change the report period, click the Last 1 hour icon on the upper right corner of the graph, and select Last 6 hour , Today , Yesterday , This week , This month , or This year from the list.
Figure 179 File Information area layout The File Information area contains the following fields: • Refresh icon • Last 1 hour icon —The file send/receive rate trend graph shows the trend of the file send/receive rates in the last hour by default. To change the report period, click the Last 1 hour icon on the upper right corner of the graph, and select Last 6 hour , Today , Yesterday , This week , This month , or This year from the list.
Anonymous Access The Anonymous Access area layout is shown in Figure 180. Figure 180 Anonymous Access area layout The Anonymous Access area contains the following fields: • Refresh icon • Last 1 hour icon —The anonymous access trend graph shows the trend of the anonymous accesses in the last hour by default. To change the report period, click the Last 1 hour icon on the upper right corner of the graph, and select Last 6 hour , Today , Yesterday , This week , This month , or This year from the list.
Non-anonymous Access The Non-anonymous Access area layout is shown in Figure 181. Figure 181 Non-Anonymous Access area layout The Non-Anonymous Access area contains the following fields: • Refresh icon • Last 1 hour —The non-anonymous access trend graph shows the trend of the non-anonymous accesses in the last hour by default.
PHP Hypertext Preprocessor (PHP) is a scripting language embedded in the HTML text, and is usually used to develop Web programs. When a user accesses Web pages developed by using the PHP language, the Web server first delivers the Web pages with the PHP language embedded to the PHP service for parsing, and then sends the parsed pages to the user. APM can monitor the PHP service which is responsible for parsing pages.
applications for PHP, the operator cannot select operating system applications, including Windows XP, Windows Server, AIX, FreeBSD, OpenBSD, HP-UX, Solaris, Mac OS, and Linux. 5. Detect Application—Enable or disable application detection. Application detection enables APM to verify connection to the application by using the previous parameter settings, and to determine whether to add the application monitor based on the verification result.
select this parameter, APM will modify the application monitor without verifying the connection. 4. Click OK. Viewing the PHP application monitor report After you add the PHP application monitor, APM starts collecting index data of the application to calculate its availability and health status. Through the PHP application monitor report, operators can obtain monitor indexes of the application. To access the PHP application monitor report: 1. Click the Resource tab. 2.
Monitor Information Figure 183 Monitor Information area layout The Monitor Information area contains the following fields: • Refresh icon —Click the Refresh icon to refresh the area. • Name—Application monitor name. • Health State—Health status of PHP. • IP Address—IP address of the Web server which can parse PHP. • Application Type—Type of the application, which is always PHP. • Port—Port through which the Web server provides services.
Figure 184 Availability Today area layout The Availability Today area contains the following fields: • Refresh icon • Availability pie chart—Shows time duration percentages of the availability states for PHP today. The availability states include Available, Unavailable, Inaccessible, and Unmanaged. To view the time duration percentage of a specific availability state, place the cursor over the corresponding slice in the chart. • Current Availability—Availability of PHP when APM last polled PHP.
Figure 185 Response Time area layout The Response Time area contains the following fields: • Refresh icon • Last 1 hour icon —The response time trend graph shows the trend of the response time in the last hour by default. To change the report period, click the Last 1 hour icon on the upper right corner of the graph, and select Last 6 hour , Today , Yesterday , This week , This month , or This year from the list.
13 Mail server monitor APM supports monitoring the following mail servers: • Exchange Server 2003 • Exchange Server 2007 • POP3 • SMTP This chapter describes how to add and modify mail server application monitors and helps you view relevant monitor reports. Exchange Server 2003 The Microsoft Exchange Server 2003 provides mail services for domain users by cooperating with Active Directory. It supports SMTP, POP3, and IMAP4 mail protocols.
Description—Enter a description for the application monitor to aid maintenance. IP Address—Click Select and select the target host where Exchange Server 2003 is installed in the Select Devices window. Polling Interval (min)—Select a polling interval for the application monitor. Available options include 1, 2, 3, 4, 5, 10, 20, and 30. The default polling interval is 5 minutes. A shorter polling interval provides more accurate real-time data but requires higher performance.
2. Select Application Manager > Application Monitor from the navigation tree. The application monitor list page appears. 3. Click the Modify icon for the Exchange 2003 application monitor you want to modify. The page for modifying the Exchange Server 2003 application monitor appears. 4. Modify the following parameters for the application monitor: Name—Enter the application monitor name, which must be unique in APM.
5. Click OK. Viewing the Exchange Server 2003 application monitor report After you add an Exchange Server 2003 application monitor, APM starts collecting index data of the application to calculate its availability and health status. Operators can obtain monitor indexes for Exchange Server 2003 by viewing the monitor report. To access the Exchange Server 2003 application monitor report: 1. Click the Resource tab. 2. Select Application Manager > Application Monitor from the navigation tree.
The Monitor Information area contains the following fields: • Refresh icon —Click the Refresh icon to refresh the area. • Name—Application monitor name. • Health State—Health status of the Exchange Server 2003 application. • IP Address—IP address of the Exchange Server 2003 host. • Application Type—Type of the application, which is always Exchange 2003. • Last Polling Time—Time when APM last polled the Exchange Server 2003 application.
To view the availability of Exchange Server 2003 in the last 30 days, click the Monthly History icon . The monthly availability data is collected in days. To view the time duration percentages of availability states on a specific day, place the cursor over that day. • Available Time—Total available time duration of Exchange Server 2003 since 00:00 today. • Unavailable Time—Total unavailable time duration of Exchange Server 2003 since 00:00 today.
Figure 190 POP area layout The POP area contains the following fields: • Last 1 Hour icon —By default, the POP connection trend graph shows changes of the POP connections used by Exchange Server 2003 over the last one hour. To change the report period, click the Last 1 Hour icon on the upper right of the graph, and then select an icon from the list. Available options include Last 6 Hours , Today , Yesterday , This Week , This Month , and This Year .
Figure 191 Mailbox area layout The Mailbox area contains the following fields: • Refresh icon • Attribute/Value—Monitor index name and data. —Click the Refresh icon to refresh the area. Size—Disk space occupied by all mailboxes when APM last polled Exchange Server 2003. Rx Queue Length—Number of mails in the mailbox receive queue when APM last polled Exchange Server 2003. Tx Queue Length—Number of mails in the mailbox transmit queue when APM last polled Exchange Server 2003.
Figure 192 Public Folder area layout The Public Folder area contains the following fields: • Refresh icon • Attribute/Value—Monitor index name and data. —Click the Refresh icon to refresh the area. Size—Disk space occupied by all public folders when APM last polled Exchange Server 2003. Tx Queue Length—Number of mails in the public folder storage transmit queue when APM last polled Exchange Server 2003.
Figure 193 Statistics area layout The Statistics area contains the following fields: • • Refresh icon —Click the Refresh icon to refresh the area. Attribute/Value—Monitor index name and data. Active Connections—Number of connections to a mailbox or public folder in the last 10 minutes when APM last polled Exchange Server 2003. Connections—Number of client connections to the Exchange information store when APM last polled Exchange Server 2003.
Figure 195 AL area layout The AL area contains the following fields: • Refresh icon • Attribute/Value—Monitor index name and data. —Click the Refresh icon to refresh the area. Address List Queue Length—Address list queue length when APM last polled Exchange Server 2003. ES The ES area monitors notifications or events of Exchange Server 2003. The ES area layout is shown in Figure 196.
• Refresh icon • Attribute/Value—Monitor index name and data. —Click the Refresh icon to refresh the area. Working Queue Length—Number of mails that have not been processed by MTA in the working queue when APM last polled Exchange Server 2003. Bytes/Min—Number of bytes of mails processed by MTA per minute when APM last polled Exchange Server 2003. Bytes Received/Min—Number of bytes received by MTA through TCP/IP connections per minute when APM last polled Exchange Server 2003.
Messages Sent/Min—Number of mails sent by Exchange Server 2003 per minute when APM last polled Exchange Server 2003. Host Cache Hits—Number of cache hits when APM last polled Exchange Server 2003.
• Inbound Connections—Inbound SMTP connections when APM last polled Exchange Server 2003. • Outbound Connections—Outbound SMTP connections when APM last polled Exchange Server 2003. • Local Retry Queue Length—Retry queue length of mails delivered locally when APM last polled Exchange Server 2003. • Local Queue Length—Queue length of mails delivered locally when APM last polled Exchange Server 2003.
3. Select Application Manager > Application Monitor from the navigation tree, and click Add on the application monitor list page. Click Exchange 2007 of the Mail Server Monitor class. The page for adding an Exchange Server 2007 application monitor appears. 4. Configure the following parameters for the application monitor: Name—Enter the application monitor name, which must be unique in APM.
5. Related Applications—Click Add. The Select Applications window appears. Select the applications that Exchange Server 2007 depends on, and click OK. You cannot select operating system applications, such as Windows XP, Windows Server, AIX, FreeBSD, OpenBSD, HP-UX, Solaris, Mac OS, and Linux. You can view the dependencies between applications in a topology view. Detect Application—Enable or disable application detection.
5.
Figure 201 Part of an Exchange Server 2007 application monitor report The previous monitor report is for the application monitor named Exchange 2007_192.168.20.220. The health status of the Exchange Server 2007 application is Healthy . If another health status icon rather than the Healthy icon appears, you can click that icon to view the root cause and health analysis. To refresh the report page, click the Refresh icon next to the Healthy icon .
Availability Today The Availability Today area layout is shown in Figure 203. Figure 203 Availability Today area layout The Availability Today area contains the following fields: • Refresh icon • Availability pie chart—Shows time duration percentages of the availability states for Exchange Server 2007 today. The availability states include Available, Unavailable, Inaccessible, and Unmanaged.
Figure 204 IMAP4 area layout The IMAP4 area contains the following fields: • Last 1 Hour icon —By default, the IMAP4 connection trend graph shows changes of the IMAP4 connections used by Exchange Server 2007 over the last one hour. To change the report period, click the Last 1 Hour icon on the upper right of the graph, and then select an icon from the list. Available options include Last 6 Hours , Today , Yesterday , This Week , This Month , and This Year .
Figure 205 POP3 area layout The POP3 area contains the following fields: • Last 1 Hour icon —By default, the POP3 connection trend graph shows changes of the POP3 connections used by Exchange Server 2007 over the last one hour. To change the report period, click the Last 1 Hour icon on the upper right of the graph, and then select an icon from the list. Available options include Last 6 Hours , Today , Yesterday , This Week , This Month , and This Year .
Figure 206 SMTP Send area layout The SMTP Send area contains the following fields: • Last 1 Hour icon —By default, the SMTP Send trend graph shows changes of the outbound SMTP connections used by Exchange Server 2007 over the last one hour. To change the report period, click the Last 1 Hour icon on the upper right of the graph, and then select an icon from the list. Available options include Last 6 Hours , Today , Yesterday , This Week , This Month , and This Year .
SMTP Receive The SMTP Receive area layout is shown in Figure 207. Figure 207 SMTP Receive area layout The SMTP Receive area contains the following fields: • Last 1 Hour icon —By default, the SMTP Receive trend graph shows changes of the inbound SMTP connections used by Exchange Server 2007 over the last one hour. To change the report period, click the Last 1 Hour icon on the upper right of the graph, and then select an icon from the list.
Buffer State The Buffer State area layout is shown in Figure 208. Figure 208 Buffer State area layout The Buffer State area contains the following fields: • Refresh icon • Attribute/Value—Monitor index name and data. —Click the Refresh icon to refresh the area. Uncompleted RPC Requests—Number of RPC requests that have not been processed when APM last polled Exchange Server 2007. RPC Requests Sent/Sec—Number of RPC requests sent per second when APM last polled Exchange Server 2007.
Figure 209 Transmit Queue State area layout The Transmit Queue State area contains the following fields: • Refresh icon • Attribute/Value—Monitor index name and data. Active Mailbox Queue Length—Number of mails in the active mailbox transmit queue when APM last polled Exchange Server 2007. —Click the Refresh icon to refresh the area. Message for Delivery/Sec—Number of items to be delivered per second when APM last polled Exchange Server 2007.
Active Directory Access State The Active Directory Access State area layout is shown in Figure 211. Figure 211 Active Directory Access State area layout The Active Directory Access State area contains the following fields: • Refresh icon • Attribute/Value—Monitor index name and data. —Click the Refresh icon to refresh the area. Buffer Hits/Sec—Number of active directory buffer hits per second when APM last polled Exchange Server 2007.
• Microsoft Exchange Active Directory Topology • Microsoft Exchange Anti-spam Update • Microsoft Exchange EdgeSync • Microsoft Exchange File Distribution • Microsoft Exchange IMAP4 • Microsoft Exchange Information Store • Microsoft Exchange Mailbox Assistants • Microsoft Exchange Mail Submission • Microsoft Exchange Monitoring • Microsoft Exchange POP3 • Microsoft Exchange Replication • Microsoft Exchange System Attendant • Microsoft Exchange Search Indexer • Microsoft Exchange Se
• State—Service state when APM last polled Exchange Server 2007. • More—Click More to view status of all services that are being monitored. POP3 The Post Office Protocol with version 3 (POP3) enables local email clients to retrieve mail messages from a remote mail server to their local hosts for management. Most mail servers support POP3. This section describes how to add and modify the application monitor for POP3, and helps you view the monitor report.
5. Detect Application—Enable or disable application detection. Application detection enables APM to verify connection to the application by using the previous parameter settings, and to determine whether to add the application monitor based on the verification result. APM adds the application monitor only when it can connect to the application. If you do not select this parameter, APM will add the application monitor without verifying the connection. Click OK.
Viewing the POP3 application monitor report After you add a POP3 application monitor, APM starts collecting index data of the application to calculate its availability and health status. Operators can obtain monitor indexes for POP3 by viewing the monitor report. To access the POP3 application monitor report: 1. Click the Resource tab. 2. Select Application Manager > Application Monitor from the navigation tree. The application monitor list page displays all application monitors. 3.
• Refresh icon —Click the Refresh icon to refresh the area. • Name—Application monitor name. • Health State—Health status of the POP3 application. • IP Address—IP address of the POP3 host. • Application Type—Type of the application, which is always POP3. • Port—POP3 service port. • Last Polling Time—Time when APM last polled the POP3 application. • Top5 Unrecovered Alarms—Latest five unrecovered alarms on the POP3 host.
To view the availability of the POP3 service in the last 30 days, click the Monthly History icon . The monthly availability data is collected in days. To view the time duration percentages of availability states on a specific day, place the cursor over that day. • Available Time—Total available time duration of the POP3 service since 00:00 today. • Unavailable Time—Total unavailable time duration of the POP3 service since 00:00 today.
interval, yesterday's, weekly, and monthly data is collected in hours, and yearly data is collected in days. The statistics graph contains maximum, minimum, and average response time values. Place the cursor over a spot in the curve to view response time values at the specific time point. SMTP Simple Mail Transfer Protocol (SMTP) is an Internet standard protocol for email transmission between source and destination addresses. Most mail servers support SMTP.
5. Contact—Enter the contact information, such as name, email address, and telephone number. Related Applications—Click Add. The Select Applications window appears. Select the applications that SMTP depends on, and click OK. You cannot select operating system applications, such as Windows XP, Windows Server, AIX, FreeBSD, OpenBSD, HP-UX, Solaris, Mac OS, and Linux. You can view the dependencies between applications in a topology view. Detect Application—Enable or disable application detection.
5. Detect Application—Enable or disable application detection. Application detection enables APM to verify connection to the application by using the previous parameter settings, and to determine whether to add the application monitor based on the verification result. APM adds the application monitor only when it can connect to the application. If you do not select this parameter, APM will add the application monitor without verifying the connection. Click OK.
Monitor Information Figure 219 Monitor Information area layout The Monitor Information area contains the following fields: • Refresh icon —Click the Refresh icon to refresh the area. • Name—Application monitor name. • Health State—Health status of the SMTP application. • IP Address—IP address of the SMTP host. • Application Type—Type of the application, which is always SMTP. • Port—SMTP service port. • Last Polling Time—Time when APM last polled the SMTP application.
The Availability Today area contains the following fields: • Refresh icon • Availability pie chart—Shows time duration percentages of the availability states for SMTP today. The availability states include Available, Unavailable, Inaccessible, and Unmanaged. To view the time duration percentage of a specific availability state, place the cursor over the corresponding slice in the chart. • Current Availability—Availability of the SMTP service in the last polling period.
Set Threshold icon —Click the Set Threshold icon to set alarm thresholds for the SMTP service response time. The specified alarm thresholds appear on the response time trend graph as dotted lines in different colors: yellow for the level-1 threshold and red for level-2. The response time value is highlighted in yellow when it reaches the level-1 threshold, and is highlighted in red when it reaches the level-2 threshold. You can use either the global thresholds or user-defined thresholds.
14 Web service monitor APM supports monitoring the following types of Web services: • RESTful Web service • SOAP-based Web service This chapter describes how to add and modify Web service monitors, and helps you view relevant monitor reports. RESTful Web service Representational State Transfer (REST) is a predominant Web service design model and typically applies to HTTP-based APIs. A Web API or service that complies with constraints of REST architecture is called "RESTful Web service.
5. Polling Interval (min)—Select a polling interval for the application monitor. Available options include 1, 2, 3, 4, 5, 10, 20, and 30. The default polling interval is 5 minutes. A shorter polling interval provides more accurate real-time data, but requires higher performance. Username/Password—Enter the username and password used to access the RESTful Web service if the service requires identity authentication. Path—Enter the URL of the RESTful Web service.
5. Path—Enter the URL for the RESTful Web service. Do not include the IP address or port information in the URL. APM determines whether the RESTful Web service is available by accessing the specified URL. Contact—Enter the contact information, such as name, email address, and telephone number. Related Applications—Click Add. The Select Applications window appears. Select the applications that the RESTful Web service depends on, and click OK.
Monitor Information Figure 223 Monitor Information area layout The Monitor Information area contains the following fields: • Refresh icon —Click the Refresh icon to refresh the area. • Name—Application monitor name. • Health State—Health status of the RESTful Web service. • IP Address—IP address of the host on which the RESTful Web service is located. • Application Type—Type of the application, which is always REST Service. • Last Polling Time—Time when APM last polled the RESTful Web service.
Figure 224 Availability Today area layout The Availability Today area contains the following fields: • Refresh icon • Availability pie chart—Shows time duration percentages of the availability states for RESTful Web service today. The availability states include Available, Unavailable, Inaccessible, and Unmanaged. To view the time duration percentage of a specific availability state, place the cursor over the corresponding slice in the chart.
Figure 225 Response time area layout The Response Time area contains the following fields: • Refresh icon • Last 1 Hour icon —By default, the response time trend graph shows changes of the response time of the RESTful Web service over the last one hour. To change the report period, click the Last 1 Hour icon on the upper right of the graph, and then select an icon from the list. Available options include Last 6 Hours , Today , Yesterday , This Week , This Month , and This Year .
Adding a SOAP-based Web service application monitor APM monitors a SOAP-based Web service through the HTTP port that service uses. When you add a SOAP-based Web service application monitor, make sure the following requirements are satisfied: • The host on which the SOAP-based Web service you want to monitor is located must be added to the IMC Platform. For information about adding hosts to the IMC Platform, see IMC Base Platform Administrator Guide for the chapter on resource management.
5. Click OK. Modifying a SOAP-based Web service application monitor Operators can modify all parameters except the IP address of a SOAP-based Web service application monitor. If the IP address of a SOAP-based Web service host that is being monitored changes, operators must add a new application monitor for the host. To modify a SOAP-based Web service application monitor: 1. Click the Resource tab. 2. Select Application Manager > Application Monitor from the navigation tree.
Viewing the SOAP-based Web service application monitor report To access the SOAP-based Web service application monitor report: 1. Click the Resource tab. 2. Select Application Manager > Application Monitor from the navigation tree. The application monitor list page displays all application monitors. 3. Click the name link of a SOAP-based Web service application monitor. The monitor report of SOAP-based Web service appears, as shown in Figure 226.
• Health State—Health status of the SOAP-based Web service. • IP Address—IP address of the host on which the SOAP-based Web service is located. • Application Type—Type of the application, which is always SOAP Service. • Last Polling Time—Time when APM last polled the SOAP-based Web service. • Relationship—Click the Related Applications icon to view dependencies between the SOAP-based Web service and other applications in a topology view.
• Unavailable Time—Total unavailable time duration of the SOAP-based Web service since 00:00 today. • Inaccessible Time—Total inaccessible time duration of the SOAP-based Web service since 00:00 today. • Unmanaged Time—Total unmanaged time duration of the SOAP-based Web service since 00:00 today. The availability time statistics of a new application monitor are collected since the application monitor was added. An availability time field does not appear if its value is 0.
in days. The statistics graph contains maximum, minimum, and average response times. Place the cursor over a spot in the curve to view response times of the service at the specific time point.
15 LDAP service monitor APM supports monitoring the following LDAP services: • Active Directory service • LDAP service This chapter describes how to add and modify LDAP service application monitors and helps you view relevant monitor reports. Active Directory service Active Directory (AD) is a directory service developed based on Lightweight Directory Access Protocol (LDAP) to run on the Windows Server operating systems. Administrators can easily locate the objects stored in the AD.
Polling Interval (min)—Select a polling interval for the application monitor. Available options include 1, 2, 3, 4, 5, 10, 20, and 30. The default polling interval is 5 minutes. A shorter polling interval provides more accurate real-time data, but requires higher performance. Contact—Enter the contact information, such as name, email address, and telephone number. Username—Enter the username of the administrator who can manage the host (Windows Server) where the AD service is located.
Username—Modify the username of the administrator who can manage the host (Windows Server) where the AD service is located. If the administrator is a domain user, use the domain name\username format. If the administrator is a local user, use the host name\username or IP address\username format, or simply use the username. 5. Password—Modify the password of the administrator. Related Applications—Click Add. The Select Applications window appears.
Monitor Information Figure 231 Monitor Information area layout The Monitor Information area contains the following fields: • Refresh icon —Click the Refresh icon to refresh the area. • Name—Application monitor name. • Health State—Health status of the AD service. • IP Address—IP address of the AD service host. • Application Type—Type of the application, which is always Active Directory. • Last Polling Time—Time when APM last polled the AD service.
The Availability Today area contains the following fields: • Refresh icon • Availability pie chart—Shows time duration percentages of the availability states for the AD service today. The availability states include Available, Unavailable, Inaccessible, and Unmanaged. To view the time duration percentage of a specific availability state, place the cursor over the corresponding slice in the chart. • Current Availability—Availability of the AD service in the last polling period.
• • ABClient sessions trend graph—Shows changes of the ABClient session number for the AD service over the last one hour in a line chart. Place the cursor over a spot in the curve to view the session number at the specific time point. Attribute/Value—Monitor index name and data. ABClient Sessions—Number of connected ABClient sessions of the AD service in the last APM polling period.
History icon —Click the History icon to view the statistics of the history of the ntds.dit file size in a line graph. By default, the graph shows the last hour statistics. To change the report period, click the Last 6 Hours icon , Today icon , Yesterday icon , This Week icon , This Month icon , or This Year icon on the upper right of the graph as needed.
IO Read Rate—Rate at which the NTFRS process is reading data from I/O operations in the last APM polling period. The I/O activity includes network, file, and device I/Os. IO Write Rate—Rate at which the NTFRS process is writing data to I/O operations in the last APM polling period. The I/O activity includes network, file, and device I/Os. Set Threshold icon —Click the Set Threshold icon to set alarm thresholds for the CPU usage ratio of the NTFRS process.
include Last 6 Hours Year . , Today , Yesterday , This Week , This Month , and This • CPU usage ratio trend graph—Shows changes of CPU usage ratio of the LSASS process over the last one hour in a line chart. Place the cursor over a spot in the curve to view the CPU usage ratio at the specific time point. • Attribute/Value—Monitor index name and data. CPU Usage Ratio—CPU usage ratio of the LSASS process in the last APM polling period.
Figure 237 Performance area layout The Performance area contains the following fields: • Refresh icon • Last 1 Hour icon —By default, the performance trend graph shows changes of directory reads/writes per second over the last one hour. To change the report period, click the Last 1 Hour icon on the upper right of the graph, and then select an icon from the list. Available options include Last 6 Hours , Today , Yesterday , This Week , This Month , and This Year .
change the report period, click the Last 6 Hours icon , Today icon , Yesterday icon , This Week icon , This Month icon , or This Year icon on the upper right of the graph as needed. Hourly data and today's data is collected every polling interval, yesterday's, weekly, and monthly data is collected in hours, and yearly data is collected in days. The statistics graph contains maximum, minimum, and average performance index data.
Inbound Objects/Sec—Number of objects received per second from other ADs through inbound replication in the last APM polling period. Outbound Objects/Sec—Number of objects sent per second to other ADs through outbound replication in the last APM polling period. Inbound Rate—Inbound replication rate of the current AD in the last APM polling period. Outbound Rate—Outbound replication rate of the current AD in the last APM polling period.
• LDAP statistics trend graph—Shows changes of the number of active LDAP threads/LDAP client sessions over the last one hour in a line chart. Place the cursor over a spot in the curve to view the number of active LDAP threads/LDAP client sessions at the specific time point. • Attribute/Value—Monitor index name and data. Active LDAP Threads—Number of threads used by the LDAP subsystem in the last APM polling period.
Figure 240 Active Directory Service area layout The Active Directory Service area contains the following fields: • Refresh icon —Click the Refresh icon to refresh the area. • Service Name—Original name of the service. • Display Name—Service name or alias displayed on the Windows service console. For example, on the Windows service console, the DNS client service uses the alias DNS Client rather than the original name DNScache. Typically, the display name identifies a service more clearly.
1. Click the Resource tab. 2. Enter the Add Application page in one of the following ways: Select Application Manager > Add Application from the navigation tree. The page displays all application types that can be monitored by APM. 3. Select Application Manager > Application Monitor from the navigation tree, and click Add on the application monitor list page. Click LDAP of the LDAP Service Monitor class. The page for adding an LDAP service application monitor appears. 4.
Modifying an LDAP service application monitor Operators can modify all parameters except the IP address of an LDAP service application monitor. If the IP address of the host where the LDAP service is located changes, operators must add a new application monitor for the LDAP service. However, the new application monitor cannot inherit the history data from the previous application monitor. To modify an LDAP service application monitor: 1. Click the Resource tab. 2.
the application monitor only when it can connect to the application. If you do not select this parameter, APM will add the application monitor without verifying the connection. 5. Click OK. Viewing the LDAP service application monitor report After you add the LDAP service application monitor, APM starts collecting index data of the application to calculate its availability and health status. Operators can obtain monitor indexes of the LDAP service by viewing the monitor report.
Monitor Information Figure 242 Monitor Information area layout The Monitor Information area contains the following fields: • Refresh icon —Click the Refresh icon to refresh the area. • Name—Application monitor name. • Health State—Health status of the LDAP service. • IP Address—IP address of the LDAP service host. • Application Type—Type of the application, which is always LDAP. • Port—Port used by the LDAP service. • Last Polling Time—Time when APM last polled the LDAP service.
Figure 243 Availability Today area layout The Availability Today area contains the following fields: • Refresh icon • Availability pie chart—Shows time duration percentages of the availability states for the LDAP service today. The availability states include Available, Unavailable, Inaccessible, and Unmanaged. To view the time duration percentage of a specific availability state, place the cursor over the corresponding slice in the chart.
Figure 244 Login Details area layout The Login Details area contains the following fields: • Refresh icon • Last 1 Hour icon —By default, the login time trend graph shows changes of the login time of the LDAP service over the last one hour. To change the report period, click the Last 1 Hour icon on the upper right of the graph, and then select an icon from the list. Available options include Last 6 Hours , Today , Yesterday , This Week , This Month , and This Year .
• Refresh icon • Last 1 Hour icon —By default, the search details trend graph shows changes of the search time and response time of the LDAP service over the last one hour. To change the report period, click the Last 1 Hour icon on the upper right of the graph, and then select an icon from the list. Available options include Last 6 Hours , Today , Yesterday , This Week , This Month , and This Year .
• Last 1 Hour icon —By default, the search result trend graph shows changes of the entry number of the LDAP service over the last one hour. To change the report period, click the Last 1 Hour icon on the upper right of the graph, and then select an icon from the list. Available options include Last 6 Hours , Today , Yesterday , This Week , This Month , and This Year . • Search result trend graph—Shows changes of the entry number of the LDAP service over the last one hour in a line chart.
16 File/Directory monitor APM provides the file system monitoring function that monitors the following types of applications: • File • Directory This chapter describes how to add and modify file/directory application monitors, and helps you view relevant monitor reports. File APM can monitor the size and last modification time of individual files on Windows, UNIX, and Linux operating systems. This section describes how to add a file application monitor, and helps you view the monitor report.
IP Address—Click Select and select the host where the file to be monitored is located in the Select Devices window. Polling Interval (min)—Select a polling interval for the application monitor. Available options include 1, 2, 3, 4, 5, 10, 20, and 30. The default polling interval is 5 minutes. A shorter polling interval provides more accurate real-time data, but requires higher performance. Monitor Type—Select a monitor type for the application monitor. Monitor types include WMI and CLI.
Polling Interval (min)—Select a polling interval for the application monitor. Available options include 1, 2, 3, 4, 5, 10, 20, and 30. The default polling interval is 5 minutes. A shorter polling interval provides more accurate real-time data, but requires higher performance. Monitor Type—Select a monitor type for the application monitor. Monitor types include WMI and CLI. Username—This field appears only when you select WMI for Monitor Type. Enter the username of the Windows administrator.
Figure 247 Part of a file application monitor report The previous monitor report is for the application monitor named File_172.8.9.77. The health status of the application is Major , and you can click the icon to view the root cause and health analysis. To refresh the report data, click the Refresh icon . The monitor report, as shown in Figure 248, contains multiple areas, which are described in the following sections.
• IP Address—IP address of the host where the file is located. • Application Type—Type of the application, which is always File. • Last Polling Time—Time when APM last polled the file. • Relationship—Click the Related Applications icon and other applications in a topology view. • Top5 Unrecovered Alarm—Latest five unrecovered alarms on the file. The alarm level is identified by color: yellow for minor alarms, orange for major alarms, and red for critical alarms.
• Unmanaged Time—Total unmanaged time duration of the file since 00:00 today. The availability time statistics of a new application monitor are collected since the application monitor was added. An availability time field does not appear if its value is 0. File Statistics The File Statistics area layout is shown in Figure 250. Figure 250 File Statistics area layout The File Statistics area contains the following fields: • Refresh icon —Click the Refresh icon to refresh the area.
Directory APM can monitor the size of individual directories on Windows, UNIX, and Linux operating systems. This section describes how to add and modify a directory application monitor, and helps you view the monitor report. Adding a directory application monitor APM can monitor directories through CLI or WMI.
5. Password—This field appears only when you select WMI for Monitor Type. Enter the password of the administrator. Directory Name—Enter the absolute path and name of the directory you want to monitor. Use the C:\Windows format for Windows, or the /home/Apache format for Linux and UNIX. Contact—Enter the contact information, such as name, email address, and telephone number. Related Applications—Click Add. The Select Applications window appears.
5. Directory Name—Enter the absolute path and name of the directory you want to monitor. Use the C:\Windows format for Windows, or the /home/Apache format for Linux and UNIX. Contact—Enter the contact information, such as name, email address, and telephone number. Related Applications—Click Add. The Select Applications window appears. Select the applications that the directory depends on, and click OK.
Monitor Information Figure 252 Monitor Information area layout The Monitor Information area contains the following fields: • Refresh icon —Click the Refresh icon to refresh the area. • Name—Application monitor name. • Health State—Health status of the directory. • IP Address—IP address of the host where the directory is located. • Application Type—Type of the application, which is always Directory. • Last Polling Time—Time when APM last polled the directory.
Figure 253 Availability Today area layout The Availability Today area contains the following fields: • Refresh icon • Availability pie chart—Shows time duration percentages of the availability states for the directory today. The availability states include Available, Unavailable, Inaccessible, and Unmanaged. To view the time duration percentage of a specific availability state, place the cursor over the corresponding slice in the chart.
Figure 254 Directory Statistics area layout The Directory Statistics area contains the following fields: • Refresh icon • Last 1 Hour icon —By default, the directory size trend graph shows changes of the directory size over the last one hour. To change the report period, click the Last 1 Hour icon on the upper right of the graph, and then select an icon from the list. Available options include Last 6 Hours , Today , Yesterday , This Week , This Month , and This Year .
17 Service monitor APM supports monitoring the following services: • SNMP service • DNS service This chapter describes how to add and modify the application monitors, and helps you view relevant monitor reports. SNMP service Simple Network Management Protocol (SNMP) is a network management protocol widely supported by operating systems and network devices. SNMP uses a hierarchical structure to describe nodes on the network, each of which is identified by a unique OID.
4. OID—Enter the OID for SNMP monitoring. You can obtain OIDs by using a network management tool. For example, the OID of the system up time (sysUpTime) is 1.3.6.1.2.1.1.3.0. Polling Interval (min)—Select a polling interval for the application monitor. Available options include 1, 2, 3, 4, 5, 10, 20, and 30. The default polling interval is 5 minutes. A shorter polling interval provides more accurate real-time data but requires higher performance.
system applications, such as Windows XP, Windows Server, AIX, FreeBSD, OpenBSD, HP-UX, Solaris, Mac OS, and Linux. To remove dependencies between the SNMP service and one or more applications, select the target applications in the Related Applications box and click Delete. You can view the dependencies between applications in a topology view. 5. Detect Application—Enable or disable application detection.
Monitor Information Figure 256 Monitor Information area layout The Monitor Information area contains the following fields: • Refresh icon —Click the Refresh icon to refresh the area. • Name—Application monitor name. • Health State—Health status of the SNMP service application. • IP Address—IP address of the SNMP service host. • Application Type—Type of the application, which is always SNMP Monitor. • Last Polling Time—Time when APM last polled the SNMP service.
The Availability Today area contains the following fields: • Refresh icon • Availability pie chart—Shows time duration percentages of the availability states for the SNMP service today. The availability states include Available, Unavailable, Inaccessible, and Unmanaged. To view the time duration percentage of a specific availability state, place the cursor over the corresponding slice in the chart. • Current Availability—Availability of the SNMP service in the last polling period.
• Ping Test response time trend graph—Shows changes of the round trip response time for the SNMP service over the selected time period in a line chart. Place the cursor over a spot in the curve to view the response time at the specific time point. • Attribute/Value—Monitor index name and data. Response Time—Round trip response time of the SNMP service in the last APM polling period. History icon —Click the History icon to view statistics of the history response time changes in a line graph.
1. Click the Resource tab. 2. Enter the Add Application page in one of the following ways: Select Application Manager > Add Application from the navigation tree. The page displays all application types that can be monitored by APM. Select Application Manager > Application Monitor from the navigation tree, and click Add on the application monitor list page. Click DNS Monitor of the Service Monitor class. 3. The page for adding a DNS service application monitor appears.
determine whether to add the application monitor based on the verification result. APM adds the application monitor only when it can connect to the application. If you do not select this parameter, APM will add the application monitor without verifying the connection. 5. Click OK. Modifying a DNS service application monitor Operators can modify all parameters except the IP address of a DNS service application monitor.
2. Select Application Manager > Application Monitor from the navigation tree. The application monitor list page displays all application monitors. 3. Click the name link of a DNS service application monitor. The monitor report of the DNS service appears, as shown in Figure 260. Figure 260 Part of a DNS service application monitor report The previous monitor report is for the application monitor named DNS_10.72.66.36. The health status of the DNS service application is Healthy .
• Relationship icon —Click the Relationship icon service and other applications in a topology view. to view dependencies between the DNS • Top5 Unrecovered Alarm—Latest five unrecovered alarms on the DNS host. The alarm level is identified by color: yellow for minor alarms, orange for major alarms, and red for critical alarms. This field does not appear if no alarm is generated by the DNS service. Availability Today The Availability Today area layout is shown in Figure 262.
Response Time The Response Time area layout is shown in Figure 263. Figure 263 Response Time area layout The Response Time area contains the following fields: • Last 1 Hour icon —By default, the response time trend graph shows changes of the ping response time over the last one hour. To change the report period, click the Last 1 Hour icon on the upper right of the graph, and then select an icon from the list.
graph contains maximum, minimum, and average response time values. Place the cursor over a spot in the curve to view the response time values at the specific time point.
18 HTTP service monitor This chapter describes how to add and modify the URL application monitor, and helps you view the monitor report. URL A uniform resource locator (URL) provides a reference to an Internet resource and a means of locating the resource. For more information about URL, see RFC 1738. You can access resources provided by HTTP services through URLs. By accessing a URL, APM judges whether the HTTP service is properly running on the host that provides the resource to which the URL links.
Solaris, Mac OS, and Linux. You can view the dependencies between applications in a topology view. 4. Detect Application—Enable or disable application detection. Application detection enables APM to verify connection to the application by using the previous parameter settings, and to determine whether to add the application monitor based on the verification result. APM adds the application monitor only when it can connect to the application.
Viewing the URL application monitor report After you add a URL application monitor, APM starts collecting index data of the application to calculate its availability and health status. Operators can obtain monitor indexes of the URL by viewing the monitor report. To access the URL application monitor report: 1. Click the Resource tab. 2. Select Application Manager > Application Monitor from the navigation tree. The application monitor list page displays all application monitors. 3.
• Name—Application monitor name. • Health State—Health status of the URL application. • IP Address—IP address of the HTTP service host. • Application Type—Type of the application, which is always URL. • Port—Port number used by the HTTP service. • Last Polling Time—Time when APM last polled the URL application. • Top5 Unrecovered Alarm—Latest five unrecovered alarms on the URL. The alarm level is identified by color: yellow for minor alarms, orange for major alarms, and red for critical alarms.
• Unmanaged Time—Total unmanaged time duration of the URL service since 00:00 today. The availability time statistics of a new application monitor are collected since the application monitor was added. An availability time field does not appear if its value is 0. Response Time The Response Time area layout is shown in Figure 267.
Page Size APM examines the size of the requested Web page, and records changes of the page size in a trend graph, as shown in Figure 268. Figure 268 Page Size area layout The Page Size area contains the following fields: • Last 1 Hour icon —By default, the page size trend graph shows changes of the Web page size over the last one hour. To change the report period, click the Last 1 Hour icon on the upper right of the graph, and then select an icon from the list.
19 Support and other resources Contacting HP For worldwide technical support information, see the HP support website: http://www.hp.
• HP Networking http://www.hp.com/go/networking • HP manuals http://www.hp.com/support/manuals • HP download drivers and software http://www.hp.com/support/downloads • HP software depot http://www.software.hp.com Conventions This section describes the conventions used in this documentation set. Command conventions Convention Description Boldface Bold text represents commands and keywords that you enter literally as shown. Italic Italic text represents arguments that you replace with actual values.