
HP Intelligent Management Center v5.1 SP1 Application Manager Administrator Guide

95
3.
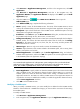
Click the Modify icon of the FreeBSD monitor you want to modify. The Modify-FreeBSD
page appears.
4. Specify the parameters for the FreeBSD monitor.
For more information, see “Adding a FreeBSD application monitor.”
5. Click OK.
Viewing FreeBSD monitoring report
After adding a FreeBSD monitor, you can view the evaluation result and related monitored indexes of
the monitored FreeBSD system in the monitoring report.
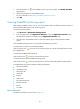
To view the monitoring report:
1. Click Resource > Application Management.
2. In the navigation tree, click Application Monitor to open the Application Monitor page.
All applications monitors are displayed in the Application Monitor page.
3. Click the name of a FreeBSD monitor to open the real-time report of the monitored FreeBSD
system.
In the FreeBSD monitoring report, you can perform the following operations:
To analyze the root cause of an unhealthy FreeBSD:
Click the analysis icon on the top of the monitoring report to view the potential factors that cause
the unhealthy state.
To refresh the FreeBSD monitoring report:
Click the refresh icon on the top of the monitoring report.
To refresh each pane of the FreeBSD monitoring report:
Click the refresh icon on the top of each pane to view the corresponding latest monitoring data.
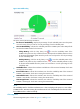
A FreeBSD monitoring report includes the following information:
• Monitor information
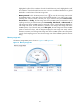
• Availability today
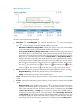
• CPU usage ratio
• Usage ratio
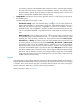
• Ping test
• System load
• File system usage ratio
• Network interface
• Process
• I/O status
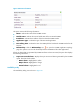
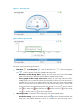
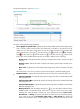
Monitor information
The Monitor Information pane is shown in Figure 59.