
HP Intelligent Management Center v5.1 SP1 Application Manager Administrator Guide

97
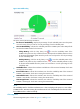
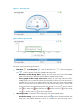
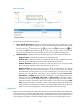
Figure 60 Available today
This pane contains the following information:
• Pie chart of Availability—Display the percentage of each availability state. Move the pointer
over each section of the pie chart to view the percentage of each availability state.
• Current Availability—Indicate the availability state of the FreeBSD system when APM polls the
host that the FreeBSD resides for the last time.
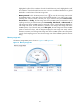
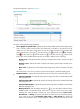
7-day History—Click the 7-day history icon to view the availability states of the
FreeBSD in the past seven days. With this function, APM provides availability statistics in hours
for the monitored FreeBSD system. Move the pointer over each period to view the percentage
of each availability state.
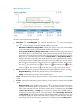
30-day History—Click the 30-day history icon to view the availability states of the
FreeBSD in the past thirty days. With this function, APM provides availability statistics in days
for the monitored FreeBSD. Move the pointer over each date to view the percentage of each
availability state.
• Available Time—Indicate the cumulative available time of the monitored FreeBSD, which starts
counting from 00:00 today.
• Inaccessible Time—Indicate the cumulative time when the availability state of the monitored
FreeBSD is inaccessible, which starts counting from 00:00 today.
• Unavailable Time—Indicate the cumulative time when the availability state of the monitored
FreeBSD is unavailable, which starts counting from 00:00 today.
• Unmanaged Time—Indicate the cumulative time when the availability state of the monitored
FreeBSD is unmanaged, which starts counting from 00:00 today.
NOTE:
The availability state for which the
cumulative time is 0 does not display in this pane. For a new-added
FreeBSD monitor, APM start counting the cumulative time of each availability state from the time when
the FreeBSD monitor is added successfully.
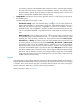
CPU usage ratio
The CPU Usage Ratio pane is shown in Figure 61 and Figure 62.