
HP Intelligent Management Center v5.1 SP1 Application Manager Administrator Guide

102
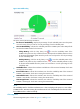
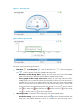
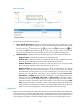
Figure 65 Ping test
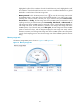
This pane contains the following information:
• Curve graph of Ping test—Display the result trend of the Ping tests in the past one hour by
default. You can also select a time period to view the result trend in the specified time period. Click
the Last 1 hour icon , the Last 6 hours icon , the Today icon , the Yesterday icon , the
This week icon , the This month icon , or the This year icon to select a time period.
Move the pointer to the curve to view the Ping response time of a specified sampling point.
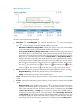
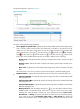
• Attribute/Value—Displays the monitored indexes and its value. The monitored indexes are:
Response Time—Indicate the response time of the latest Ping test.
Packets Sent—Indicate the number of ICMP packets that are sent by APM in the last Ping
test. During a Ping test, APM can send up to three ICMP packets to the host.
Packets Received—Indicate the number of ICMP response that are received by APM
during a Ping test. The number of the received response can be 0 or 1.
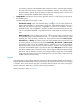
History Record—Click the History Record icon to view the trend of the Ping test
indexes in a past time period, which includes the response time, packets sent, packets
received indexes. The time periods you can view include the last 1 hour, last 6 hours, today,
yesterday, this week, this month, and this year. If you select the time period Last 1 hour,
Last 6 hours, or Today, the Ping test indexes is measured in unit of a polling interval; if you
select the time period Yesterday, This week, or This month, the Ping test indexes is
measured in hours, and the diagram displays the trends of the Ping test indexes, and the
maximum, minimize, and average values of the indexes; if you select the time period This
year, the Ping test indexes is measured in days, and the diagram displays the trends of the
Ping test indexes, and the maximum, minimize, and average values of the indexes. Move the
pointer over the each sampling point to view the Ping test result for the time being.
System load
APM can analyze and display the system load average for the monitored FreeBSD in the specified time
period (one minute, five minutes, and fifteen minutes). System load average is the average number of
the processes running on the FreeBSD system during a specified time period. Excessive system load can
cause performance problems, and the thresholds of system load vary across different types of CPU.