
HP Intelligent Management Center v5.1 SP1 Application Manager Administrator Guide

124
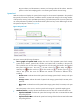
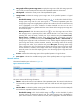
Figure 83 Monitor information
This pane contains the following information:
• Name—Indicate the name of the OpenBSD monitor.
• Health status—Indicate the current health status of the monitored OpenBSD.
• IP Address—Indicate the IP address of the host that the OpenBSD resides.
• Application Type—Indicate the type of the monitored application.
• Last Polling Time—Indicate the time when APM polls the host that the OpenBSD resides for the
last time.
• Relationship—Click the Relationship icon to open the OpenBSD application topology
page. The operator can view the relationship between OpenBSD and the other applications.
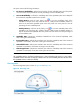
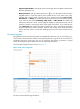
If there are alarms that are generated by OpenBSD and have not been recovered, this pane also
displays the following information:
• Top5 unrecovered alarm—Displays the top5 unrecovered alarms generated by the OpenBSD
system. The alarm levels include:
Minor alarm—Highlighted in yellow.
Major alarm—Highlighted in orange.
Critical alarm—Highlighted in red.
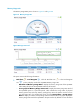
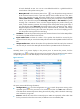
Availability today
The Availability Today pane is shown in Figure 84.
Figure 84 Available today