
HP Intelligent Management Center v5.1 SP1 Application Manager Administrator Guide

126
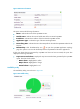
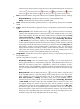
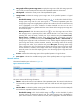
Figure 86 CPU usage ratio trend
This pane contains the following information:
• Dial Plate /Trend Diagram —Click the Dial Plate icon or the Trend Diagram
icon to select a display mode of the OpenBSD CPU usage ratio.
Dial Plate of CPU Usage Ratio—Display the CUP usage ratio trend of the OpenBSD
system when the last time APM polls the host that the OpenBSD resides.
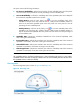
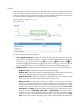
Curve graph of CPU usage ratio trend—Display the CPU usage ratio trend of the
OpenBSD over a certain time period. Move the pointer to the curve to view the ratio of a
specified time point. The curve graph displays the CPU usage ratio trend of the OpenBSD
system in the past one hour by default. You can also select a time period to view the CPU
usage ratio trend in the specified time period. Click the Last 1 hour icon , the Last 6 hours
icon , the Today icon , the Yesterday icon , the This week icon , the This month
icon , or the This year icon to select a time period.
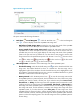
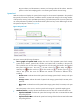
• CPU Usage Ratio—Indicate the current CPU usage ratio of the OpenBSD system.
Threshold setting—Click the threshold setting icon to set the alarm threshold of CPU
usage ratio. The enabled threshold is shown in a dotted line. The CPU usage ratio is
highlighted in yellow if the conditions of Level-1 threshold are met, and is highlighted in red if
the conditions of Level-2 threshold are met. You can set a user-defined threshold or a global
threshold to control alarms of the CPU usage ratio.
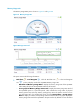
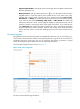
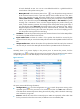
History Record—Click the History Record icon to view the CPU usage ratio trend of
the OpenBSD system in a past time period, which includes the last 1 hour, last 6 hours, today,
yesterday, this week, this month, and this year. If you select the time period Last 1 hour,
Last 6 hours, or Today, the CPU usage ratio of the OpenBSD system is measured in unit of
a polling interval; if you select the time period Yesterday, This week, or This month, the
CPU usage ratio of the OpenBSD system is measured in hours, and the diagram displays the
CPU usage ratio trend, and the maximum, minimize, and average CPU usage ratio of the
OpenBSD system; if you select the time period This year, the CPU usage ratio of the
OpenBSD system is measured in days, and the diagram displays the CPU usage ratio trend,
and the maximum, minimize, and average CPU usage ratio of the OpenBSD system. Move the
pointer over the each sampling point to view the CPU usage ratio of the OpenBSD system for
the time being.