
HP Intelligent Management Center v5.1 SP1 Application Manager Administrator Guide

130
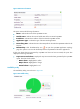
Ping test indexes, and the maximum, minimize, and average values of the indexes. Move the
pointer over the each sampling point to view the Ping test result for the time being.
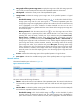
System load
APM can analyze and display the system load average for the monitored OpenBSD in the specified
time period (one minute, five minutes, and fifteen minutes). System load average is the average number
of the processes running on the OpenBSD system during a specified time period. Excessive system load
can cause performance problems, and the thresholds of system load vary across different types of CPU.
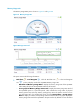
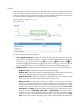
The System Load pane is shown in Figure 90.
Figure 90 System load
This pane contains the following information:
• Curve graph of system load—Display the trend of the OpenBSD system load average
(system load/1 minutes, system load/5 minutes, and system load/15 minutes) in the past one
hour by default. You can also select a time period to view the system load trend in the specified
time period. Click the Last 1 hour icon , the Last 6 hours icon , the Today icon , the
Yesterday icon , the This week icon , the This month icon , or the This year icon to
select a time period. The curves for different time intervals are marked in different colors,
including:
Green curve—Indicate the trend of system load average (system load/1 minute) in the past
one hour.
Orange curve—Indicate the trend of system load average (system load/5 minutes) in the
past hour.
Blue curve—Indicate the trend of system load average (system load/15 minutes) in the past
hour.
Move the pointer to the curve to view the system load average of a specified sampling point.
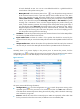
• Attribute/Value—Displays the monitored indexes and its value. The monitored indexes are:
System Load/Min—Indicate the system load average of the last one minute before APM
start polling the host.
System Load/5 Min—Indicate the system load average of the last five minutes before APM
start polling the host.