
HP Intelligent Management Center v5.1 SP1 Application Manager Administrator Guide

133
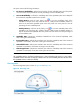
of Level-2 threshold are met. You can set a user-defined threshold or a global threshold to
control alarms of the packet receiving rate.
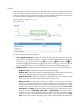
History Record—Click the History Record icon to view the packet receiving rate trend
of the monitored network card in a past time period, which includes the last 1 hour, last 6
hours, today, yesterday, this week, this month, and this year. If you select the time period Last
1 hour, Last 6 hours, or Today, the packet receiving rate is measured in unit of a polling
interval; if you select the time period Yesterday, This week, or This month, the packet
receiving rate is measured in hours, and the diagram displays the packet receiving rate
trends, and the maximum, minimize, and average values of the packet receiving rate index; if
you select the time period This year, the packet receiving rate is measured in days, and the
diagram displays the packet receiving rate trend, and the maximum, minimize, and average
values of the packet receiving rate index. Move the pointer over the each sampling point to
view the packet receiving rate for the time being.
• Send Rate—Indicate the packet sending rate of the monitored network card when APM polls the
host that the OpenBSD resides for the last time.
• Input Packet Loss—Indicate the number of lost packets that should be received by the
monitored network card per second when APM polls the host that the OpenBSD resides for the last
time.
• Output Packet Loss—Indicate the number of lost packets that should be sent by the monitored
network card per second when APM polls the host that the OpenBSD resides for the last time.
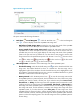
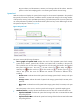
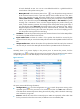
Process
Generally, there is no process displays in the process pane. To monitor the process, click the
Configuration icon to configure the processes to be monitored. The monitored processes and the
corresponding monitored index data displays in the Process pane, as shown in Figure 93.
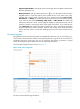
Figure 93 Process
This pane contains the following information:
• Configuration ( )—Click the Configuration icon to search the processes running on the
OpenBSD system. Select the processes to be monitored, and then click OK. APM collects the
index data for the monitored processes during the next host polling, which includes the CPU usage
ratio and memory usage ratio.
• Process—Indicate the name of the monitored process. APM can respectively collect index data
for the processes that have the same name, but different in Process Identifier (PID).