
HP Intelligent Management Center v5.1 SP1 Application Manager Administrator Guide

137
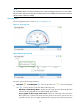
Click the analysis icon on the top of the monitoring report to view the potential factors that cause
the unhealthy state.
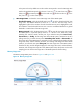
To refresh the HP-UX monitoring report:
Click the refresh icon on the top of the monitoring report.
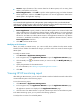
To refresh each pane of the HP-UX monitoring report:
Click the refresh icon on the top of each pane to view the corresponding latest monitoring data.
An HP-UX monitoring report includes the following information:
• Monitor information
• Availability today
• CPU usage ratio
• Usage ratio
• Ping test
• System load
• File system usage ratio
• Network interface
• Error log
• Process
• I/O status
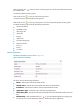
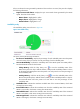
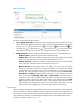
Monitor information
The Monitor Information pane is shown in Figure 95.
Figure 95 Monitor information
This pane contains the following information:
• Name—Indicate the name of the HP-UX monitor.
• Health status—Indicate the current health status of the monitored HP-UX.
• IP Address—Indicate the IP address of the host that the HP-UX resides.
• Application Type—Indicate the type of the monitored application.
• Last Polling Time—Indicate the time when APM polls the host that the HP-UX resides for the last
time.
• Relationship—Click the Relationship icon to open the HP-UX application topology page.
The operator can view the relationship between HP-UX and the other applications.