
HP Intelligent Management Center v5.1 SP1 Application Manager Administrator Guide

138
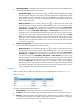
If there are alarms that are generated by HP-UX and have not been recovered, this pane also displays
the following information:
• Top5 unrecovered alarm—Displays the top5 unrecovered alarms generated by the HP-UX
system. The alarm levels include:
Minor alarm—Highlighted in yellow.
Major alarm—Highlighted in orange.
Critical alarm—Highlighted in red.
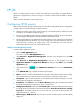
Availability today
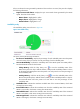
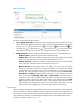
The Availability Today pane is shown in Figure 96.
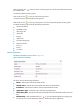
Figure 96 Available today
This pane contains the following information:
• Pie chart of Availability—Display the percentage of each availability state. Move the pointer
over each section of the pie chart to view the percentage of each availability state.
• Current Availability—Indicate the availability state of the HP-UX system when APM polls the
host that the HP-UX resides for the last time.
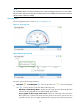
7-day History—Click the 7-day history icon to view the availability states of the
HP-UX in the past seven days. With this function, APM provides availability statistics in hours
for the monitored HP-UX system. Move the pointer over each period to view the percentage of
each availability state.
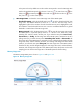
30-day History—Click the 30-day history icon to view the availability states of the
HP-UX in the past thirty days. With this function, APM provides availability statistics in days for
the monitored HP-UX. Move the pointer over each date to view the percentage of each
availability state.
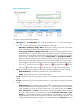
• Available Time—Indicate the cumulative available time of the monitored HP-UX, which starts
counting from 00:00 today.
• Inaccessible Time—Indicate the cumulative time when the availability state of the monitored
HP-UX is inaccessible, which starts counting from 00:00 today.
• Unavailable Time—Indicate the cumulative time when the availability state of the monitored
HP-UX is unavailable, which starts counting from 00:00 today.
• Unmanaged Time—Indicate the cumulative time when the availability state of the monitored
HP-UX is unmanaged, which starts counting from 00:00 today.