
HP Intelligent Management Center v5.1 SP1 Application Manager Administrator Guide


158
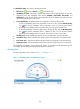
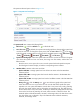
Figure 115 Ping Test area layout
The Ping Test area contains the following fields:
• Refresh icon —Click the Refresh icon to refresh the area.
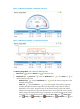
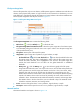
• Last 1 hour icon —By default, the response time trend graph shows changes of the ping
response time over the last one hour. To change the report period, click the Last 1 hour icon
on the upper right of the graph, and then select an icon from the list. Available options include
Last 6 hours , Today , Yesterday , This Week , This Month , and This Year .
• Response Time trend graph—Shows the trend of the round trip response time of the Linux
application over the last one hour. Place the cursor over a spot in the curve to view the response
time at the specific time point.
• Attribute/Value—Monitor index name and data.
Response Time—Round trip response time of the Linux application in the last ping operation.
Packets Sent—Number of ICMP packets that are sent in the last ping operation. The maximum
number is 3.
Packets Received—Number of ICMP response packets that are received in the last ping
operation, which is 0 or 1.
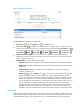
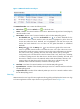
History icon —Click the History icon to view the history trend graph of the ping test
data (including the response time, the packets sent, and the packets received). Place the
cursor over a spot in the curve to view the data at the specific time point. Operators can view
statistics over the last 1 hour, last 6 hours, today, yesterday, this week, this month, and this
year by clicking the corresponding icons. The data shown in the line charts of last 1 hour, last
6 hours, and today is collected in polling intervals. The data shown in the line charts of
yesterday, this week, and this month is collected in hours. The statistical results include the
maximum, minimum, and average values. The data shown in the line chart of this year is
collected in days. The statistical results include the maximum, minimum, and average values.
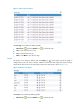
System Load
APM counts the average system load over one minute, five minutes, and fifteen minutes. The average
system load refers to the average number of processes in the run queue over a specific time interval. An
overloaded system results in severe performance issues. The load threshold value varies with CPUs.