
HP Intelligent Management Center v5.1 SP1 Application Manager Administrator Guide


171
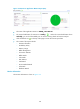
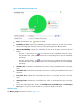
Figure 125 Memory usage-SQL Server
• Fresh—Click the Fresh Icon to update the detail.
• The curve graph displays the memory usage ratio trend of the SQL Server in the past one hour by
default. You can also select a time period to view the memory usage ratio trend in the specified
time period. Click the Last 1 hour icon , the Last 6 hours icon , the Today icon , the
Yesterday icon , the This week icon , the This month icon , or the This year icon to
select a time period.
• Memory Usage—Specify the memory usage status of SQL Server in the last hour. Green color
stands for SQL Cache Memory. Orange color stands for Optimizer Memory. Blue color stands for
Lock Memory. Brown color stands for Connection Memory.
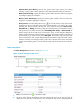
Put the mouse on the curve to view the specific data on the collection point.
Click the Icon name to display/hide the index in the trend chart.
• Attribute and Value—Specify the name and data of the memory index. The indexes include:
Total Server Memory—Specify the total sever memory submit from the buffer pool when APM
did the last polling.
SQL Cache Memory—Specify the SQL cache memory when APM did the last polling.
Optimizer Memory—Specify the memory which is used to query optimization when APM did
the last polling.
Lock Memory— Specify the memory which is used to lock when APM did the last polling.
Connection Memory—Specify the connection memory when APM did the last polling.