
HP Intelligent Management Center v5.1 SP1 Application Manager Administrator Guide


173
period. Click the Last 1 hour icon , the Last 6 hours icon , the Today icon , the Yesterday
icon , the This week icon , the This month icon , or the This year icon to select a time
period.
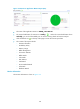
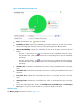
• Buffer Management—This chart displays the variation of the SQL Server Buffer Hit ratio in the last
hour. Put the mouse on the curve to view the specific data of all collection points.
• Attribute and Value—Specify the name and data of the memory index. The indexes include:
Buffer Hit Ratio—Indicate the buffer hit ratio which find in the buffer area but no need to read
in the disk. Higher ratio stands for better performance.
Searched Pages/Min—Indicate the number of the quest to search pages in the buffer pool in
one minute when APM did the last polling in SQL Server.
Read Pages/Min—Indicate the read pages per minute when APM did the last polling.
Written Pages/Min—Indicate the written pages per minute when APM did the last polling.
Total Pages—Indicate the total pages, which include stolen page, available page and
database page, when APM did the last polling.
Database Pages—Indicate the database pages contain in the buffer when APM did the last
polling.
Idle Pages—Indicate the total pages that are not used when APM did last polling.
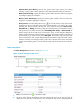
Click the “threshold value setting” icon to set the warning threshold value for Buffer Hit
Ratio. After this operation, the threshold value is shown as dashed line in the buffer hit ration
area. Yellow color stands for the Level 1 threshold value. Red color stands for the Level 2
threshold value. When it meets the level 1 threshold value warning condition, the yellow light
displays; when it meets the level 2 threshold value warning condition, the red light displays.
You can use the custom threshold or global threshold to set the threshold value.
History Record—Click the History Record icon to view the buffer related ratio trend in a
past time period, which includes the last 1 hour, last 6 hours, today, yesterday, this week, this
month, and this year. If you select the time period Last 1 hour, Last 6 hours, or Today,
the buffer related ratio of the SQL Server is measured in unit of a polling interval; if you select
the time period Yesterday, This week, or This month, the buffer related ratio of the SQL
Server is measured in hours, and the diagram displays the buffer related ratio trend, and the
maximum, minimize, and average buffer related ratio of the SQL Server; if you select the time
period This year, the buffer related ratio of the SQL Server is measured in days, and the
diagram displays the buffer related ratio trend, and the maximum, minimize, and average
buffer related ratio of the SQL Server. Move the pointer over the each sampling point to view
the buffer related ratio of the SQL Server for the time being.
Connection statistics
The Connection Statistics information is shown as Figure 127.