
HP Intelligent Management Center v5.1 SP1 Application Manager Administrator Guide

178
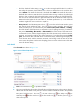
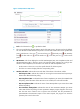
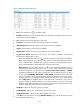
Figure 130 SQL statistics-SQL Server
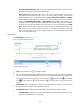
• Fresh—Click the Fresh icon to update the detail.
• The curve graph displays the SQL statistics trend of the SQL Server in the past one hour by default.
You can also select a SQL statistics time period to view the SQL statistics trend in the specified time
period. Click the Last 1 hour icon , the Last 6 hours icon , the Today icon , the Yesterday
icon , the This week icon , the This month icon , or the This year icon to select a time
period.
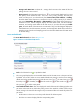
• SQL Statistics—This chart displays the trend of Batch Requests/Min, SQL Compilations/Min and
SQL Recompilations/Min in last hour. Green color stands for batch requests/min; Orange color
stands for SQL Compilations/min and blue color stands for SQL Recompilations/min.
Put the mouse on the curve to view the specific data of all collection points.
Click the icon name to display/hide the corresponding index.
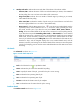
• Attribute and Value—Indicate the name and data of the indexes. The indexes include:
Batch Requests/Min—Indicate the number of receiving the Transact-SQL batch requests per
minute when APM did the last polling.
SQL Compilations/Min—Indicate the times of SQL compilations per minute when APM did the
last polling. When the status of the SQL Server user is stable, the value will be stable.
SQL Recompilations/Min—Indicate the times of SQL Recompilations per minute when APM
did the last polling.
Auto Parameter Attempts/Min—Indicate the times of Auto Parameter Attempts per minute
when APM did the last polling. The auto parameter attempts progress happens when every
time the SQL Server instance tries to replace some characters with the parameters for
parameterization Transact-SQL request. To the same requests, this progress can reuse the
operation plan saved in the cache.