
HP Intelligent Management Center v5.1 SP1 Application Manager Administrator Guide

181
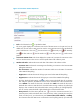
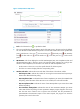
• Attribute and Value—Indicate the name and data of the indexes. The indexes include:
Full Scans/Min—Indicate the times of full scan without limitation per minute, when APM did
the last polling. This scan can base on the table or full content scan.
Range Scans/Min—Indicate the scan number of limited range by indexing in per minute,
when APM did the last polling.
Probe Scans/Min—Indicate the number of probe scans per second that are used to find at
most one single qualified row in an index or base table directly.
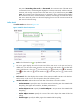
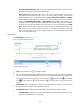
History Record—Click the History Record icon to view the access method details trend in
a past time period, which includes the last 1 hour, last 6 hours, today, yesterday, this week,
this month, and this year. If you select the time period Last 1 hour, Last 6 hours, or
Today, the access method details of the SQL Server is measured in unit of a polling interval;
if you select the time period Yesterday, This week, or This month, the access method
details of the SQL Server is measured in hours, and the diagram displays the access method
details trend, and the maximum, minimize, and average access method details of the SQL
Server; if you select the time period This year, the access method details of the SQL Server is
measured in days, and the diagram displays the access method details trend, and the
maximum, minimize, and average access method details of the SQL Server. Move the pointer
over the each sampling point to view the Access method details time of the SQL Server for the
time being.
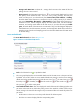
Job details
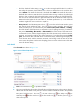
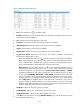
The Job Details are shown as Figure 133.
Figure 133 Job details-SQL Server
• Fresh—Click the Fresh icon to update the detail.
• Name—Indicate the job name when APM did last polling.
• Status—Specify the status of the job, (-) stands for the job is never running.
• Date—Indicate the last operating date of job.
• Time—Indicate the last operating time of job.
• Duration—Indicate the duration time of job complete.
• Tries—Indicate the times of restart when the job is running.
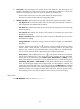
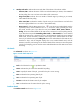
Database details
The Database Details are shown as Figure 134.