
HP Intelligent Management Center v5.1 SP1 Application Manager Administrator Guide

182
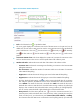
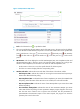
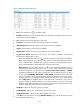
Figure 134 Database details-SQL Server
• Fresh—Click the Fresh icon to update the detail.
• Database—Indicate the name of the database when APM did last polling. Total stands for the
whole statistic for all the databases.
• Size—Indicate the size of the database in disk space.
• Transaction—Indicate the number of transaction per minute in database.
• Active Transaction—Indicate the number of the active transaction in database.
• Log File—Indicate the size of the log file of database.
• Log Files Used—Indicate the size of log files which are used in the database.
• Log Files Used Ration—Indicate the used ration of the log files in database, log files used
ration=log files used/log files *100%.
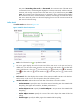
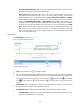
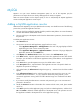
Click the “threshold value setting” icon to set the warning threshold value for the database
detail. When it meets the level 1 threshold value warning condition, the yellow light displays;
when it meets the level 2 threshold value warning condition, the red light displays. You can
use the custom threshold or global threshold to set the threshold value.
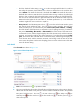
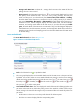
History Record—Click the History Record icon to view the database details trend in a
past time period, which includes the last 1 hour, last 6 hours, today, yesterday, this week, this
month, and this year. If you select the time period Last 1 hour, Last 6 hours, or Today,
the database details of the SQL Server is measured in unit of a polling interval; if you select
the time period Yesterday, This week, or This month, the database details of the SQL
Server is measured in hours, and the diagram displays the database details trend, and the
maximum, minimize, and average database details of the SQL Server; if you select the time
period This year, the database details of the SQL Server is measured in days, and the
diagram displays the database details trend, and the maximum, minimize, and average
database details of the SQL Server. Move the pointer over the each sampling point to view the
Database details time of the SQL Server for the time being.
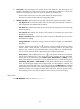
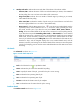
• Log Writes—Indicate the times of log writes per minute.
• Log Write Waits—Indicate the number of the log files wait to write.
• Log Write Waits Time—Indicate the time of the log files wait to write.
• Click More in the right bottom to open the Database Details page, which the operator can check
more details about SQL Server.