
HP Intelligent Management Center v5.1 SP1 Application Manager Administrator Guide

187
Availability today
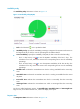
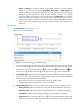
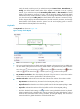
The Availability Today information is shown as Figure 137.
Figure 137 Availability today-MySQL
• Fresh—Click the Fresh icon to update the detail.
• Availability Today—Specify the availability percentage comparison for MySQL. Put the mouse on
the fragment of the pie chart to view the percentage for the different alarms.
• Current availability—Specify the availability of MySQL, the data comes from the last Polling.
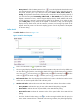
Click “7 days history” icon to view the MySQL’s availability of the last 7 days. The
calculation unit is hour; remove the mouse to the corresponding time to view the availability
percentage.
Click” 30 days history” icon to view the MySQL’s availability of the last 30 days. The
calculation unit is day; remove the mouse to the corresponding time to view the availability
percentage.
• Available Time—Indicate the accumulative time which is working available from the current day
0:00.
• Unavailable Time—Indicate the accumulative time which is working unavailable from the current
day 0:00.
• Inaccessible Time—Indicate the accumulative time which is inaccessibly from the current day
0:00.
• Unmanaged Time—Indicate the accumulative time which is unmanaged from the current day
0:00.
For the new added application monitor, the Available Time, Unavailable Time and Unmanaged Time
begin to work, if one of the elements is 0, it does not display in the report.
Response time
The Response Time information is shown as Figure 138.