
HP Intelligent Management Center v5.1 SP1 Application Manager Administrator Guide

188
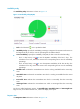
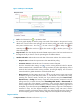
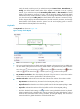
Figure 138 Response time-MySQL
• Fresh—Click the Fresh icon to update the detail.
• The curve graph displays the memory usage ratio trend of the MySQL in the past one hour by
default. You can also select a time period to view the memory usage ratio trend in the specified
time period. Click the Last 1 hour icon , the Last 6 hours icon , the Today icon , the
Yesterday icon , the This week icon , the This month icon , or the This year icon to
select a time period.
• Response Time—This chart displays the trend of MSQL response time in last hour. Put the mouse on
the fragment of the pie chart to view the percentage for the different alarms.
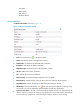
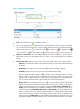
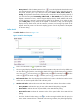
• Attribute and Value—Indicate the name and data of the monitor indexes. The indexes include:
Response Time—Indicate the response time when APM did last polling.
Connection Timeout—Indicate the time of connection timeout of MySQL.
Click the “threshold value setting” icon to set the warning threshold value for MySQL.
When it meets the level 1 threshold value warning condition, the yellow light displays; when it
meets the level 2 threshold value warning condition, the red light displays. You can use the
custom threshold or global threshold to set the threshold value.
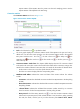
History Record—Click the History Record icon to view the memory usage ratio trend of
the memory usage in a past time period, which includes the last 1 hour, last 6 hours, today,
yesterday, this week, this month, and this year. If you select the time period Last 1 hour,
Last 6 hours, or Today, the memory usage ratio of the MySQL is measured in unit of a
polling interval; if you select the time period Yesterday, This week, or This month, the
memory usage ratio of the MySQL is measured in hours, and the diagram displays the
memory usage ratio trend, and the maximum, minimize, and average memory usage ratio of
the MySQL; if you select the time period This year, the memory usage ratio of the MySQL is
measured in days, and the diagram displays the memory usage ratio trend, and the
maximum, minimize, and average memory usage ratio of the MySQL. Move the pointer over
the each sampling point to view the memory usage ratio of the MySQL for the time being.
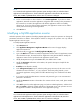
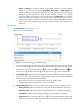
Request statistics
The Request Statistics information is shown as Figure 139