
HP Intelligent Management Center v5.1 SP1 Application Manager Administrator Guide

194
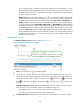
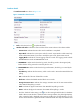
when it meets the level 2 threshold value warning condition, the red light displays. You can
use the custom threshold or global threshold to set the threshold value. Pay more attention that
the higher the hit ratio index is, the performance is better, so the threshold condition ought to
be set to “Less than or equal to.”
History Record—Click the History Record icon to view the buffer details related index
trend in a past time period, which includes the last 1 hour, last 6 hours, today, yesterday, this
week, this month, and this year. If you select the time period Last 1 hour, Last 6 hours, or
Today, the buffer details related index of the MySQL is measured in unit of a polling interval;
if you select the time period Yesterday, This week, or This month, the buffer details of
the MySQL is measured in hours, and the diagram displays the buffer details related index
trend, and the maximum, minimize, and average buffer details of the MySQL; if you select the
time period This year, the buffer details of the MySQL is measured in days, and the diagram
displays the buffer details trend, and the maximum, minimize, and average buffer details of
the MySQL. Move the pointer over the each sampling point to view the buffer details of the
MySQL for the time being.
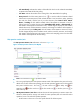
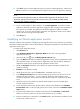
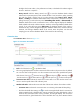
Table lock statistics/min
The Table Lock Statistics/min information is shown as Figure 144.
Figure 144 Table lock statistic/min -MySQL
• Fresh—Click the Fresh icon to update the detail.
• The curve graph displays the table lock statistics trend of the MySQL in the past one hour by
default. You can also select a time period to view the table lock statistics trend in the specified time
period. Click the Last 1 hour icon , the Last 6 hours icon , the Today icon , the Yesterday
icon , the This week icon , the This month icon , or the This year icon to select a time
period.
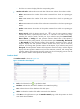
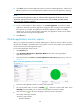
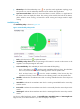
• Table Lock Statistics/min chart—This chart default displays the lock status per minute. The green
color stands for locking immediately, orange color stands for locking wait.
Put the mouse on the curve to view the specific data of all collection points.
Click the icon name to display/hide the corresponding index.
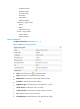
• Attribute and Value—Indicate the name and date of the monitor indexes. The indexes include: