
HP Intelligent Management Center v5.1 SP1 Application Manager Administrator Guide

202
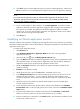
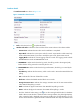
Database details
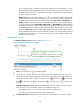
The Database Details are shown as Figure 150.
Figure 150 Database details-Oracle
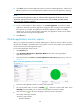
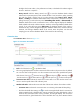
• Fresh—click the Fresh icon to update the detail.
• Attribute and Value- Indicate the name and date of the monitor indexes. The indexes include:
Creation Time—Indicate the time when Oracle installation is completed.
Open Mode—Indicate the current open mode for Oracle. Open Modes include: Read only
mode and the Read Write. If you want to modify the open mode, please restart Oracle.
Logging Mode—Indicate the current logging mode for Oracle. The logging modes include
NOARCHIVELOG mode and ARCHIVELOG mode.
a. ARCHIVELOG—When Oracle does the log switch, the old log sends to the assigned path,
before that the old log cannot be covered by the new one.
b. NOARCHIVELOG—When Oracle does the log transformation, the old log is covered by the
new one.
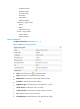
Free Memory—Indicate the free memory which can be used in SGA when APM did the last
polling.
Size—Indicate all of the size of data file in Oracle.
Block Size—Indicate the default standard block size in Oracle.
Average Execution Times—Indicate the average execution times of the SQL command line
when APM did last polling in Oracle.
Reads—Indicate the physical read times when APM did last polling in Oracle.
Writes—Indicate the physical write times when APM did last polling in Oracle.
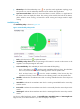
Click the “threshold value setting” icon to set the warning threshold value for database
details. When it meets the level 1 threshold value warning condition, the yellow light displays;
when it meets the level 2 threshold value warning condition, the red light displays. You can
use the custom threshold or global threshold to set the threshold value. Pay more attention that