
HP Intelligent Management Center v5.1 SP1 Application Manager Administrator Guide

14
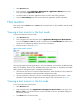
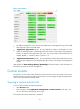
To analyze the root cause of unhealthy applications:
1. Click the Analyze icon in the monitoring report of a specified unhealthy application, as
shown in Figure 3.
Figure 3 Monitoring report
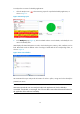
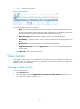
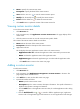
2. In the Analyze page (Figure 4), click the related nodes to view the details, and identify the root
cause of unhealthy state.
APM displays all related information as nodes, which including CPU, memory, disks, interfaces, and so
forth. APM marks nodes in different colors according to health status of the corresponding nodes, as
shown in Figure 4.
Figure 4 Root cause identifier
HP recommends that you analyze the information of nodes in yellow, orange and red to identify the
potential root causes.
NOTE:
APM cannot provide the root cause analysis facility for the applications of which availability is
unavailable, unreachable, or unmanaged. This is because APM cannot collect
all monitored indexes for
the applications of the mentioned availability.