
HP Intelligent Management Center v5.1 SP1 Application Manager Administrator Guide


209
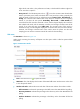
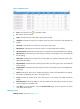
Figure 158 Details-Oracle
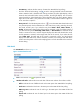
• Fresh—Click the Fresh icon to update the detail.
• ID—Indicate the ID in details.
• Status—Indicate the status when APM is doing the last polling
• Computer—Indicate the name of the computer which sets session with Oracle when APM did last
polling.
• Username—Indicate the user name when it sets session with Oracle.
• Elapsed Time—Indicate the time when the session is set during APM did last polling.
• CPU Usage Time—Indicate the time that session occupy the CPU during APM did the last polling.
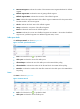
• Memory Sorts—Indicate the times of the memory sorted by user during the session when APM did
the last polling.
• Table Scans—Indicate the times of the user to do the table scan operation during the session when
APM did the last polling.
• Physical Reads—Indicate the times of the physical read by user during the session when APM did
the last polling.
• Logical Reads—Indicate the times of the logical read by user during the session when APM did the
last polling.
• Submit—Indicate the times of user submission during the session when APM did the last polling.
The number of submitting when user is during the session.
• Cursor—Indicate the number of the cursor used by user in the session when APM did the last
polling.
• Buffer Hit Ratio—Indicate the buffer hit ratio when APM did the last polling. The session logical
ratio that happens in the buffer area.
• Click More in the right bottom to open the Session Details page, which the operator can check
more details about session.
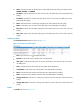
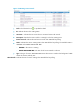
Waiting sessions
Waiting sessions are shown in Figure 159.