
HP Intelligent Management Center v5.1 SP1 Application Manager Administrator Guide

219
JIT
Just In Time (JIT) is the .NET framework just in time compiler which converts the Microsoft Intermediate
Language (MSIL) to native code on an as needed basis. CPU usage is a major indicator of JIT. The JIT
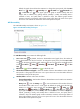
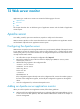
area layout is shown in Figure 166.
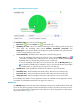
Figure 166 JIT area layout
The JIT area contains the following fields:
• Last 1 Hour icon —By default, the CPU usage in JIT trend graph shows the CPU usage trend of
JIT over the last one hour. To change the report period, click the Last 1 Hour icon on the upper
right of the graph, and then select an icon from the list. Available options include Last 6 Hours
, Today , Yesterday , This Week , This Month , and This Year .
• Refresh icon —Click the Refresh icon to refresh the area.
• CPU usage in JIT trend graph—Shows the CPU usage trend of JIT over the selected time period in
a line graph. Place the cursor over a spot in the curve to view the CPU usage at the specific time
point.
• Attribute/Value—Monitor index name and data.
CPU Usage in JIT—CPU usage of JIT in the last polling interval.
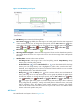
History icon —Click the History icon to view trend statistics of history CPU usage of
JIT in a line graph. By default, the graph shows the last hour statistics. To change the report
period, click the Last 6 Hours icon , Today icon , Yesterday icon , This Week icon
, This Month icon , or This Year icon on the upper right of the graph as needed.
Hourly data and today's data is collected every polling interval, yesterday's, weekly, and
monthly data is collected in hours, and yearly data is collected in days. The statistics graph
contains maximum, minimum, and average CPU usage ratios. Place the cursor over a spot in
the curve to view the CPU usage ratios at the specific time point.
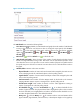
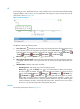
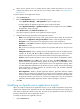
Security
The Security area layout is shown in Figure 167.