
HP Intelligent Management Center v5.1 SP1 Application Manager Administrator Guide

233
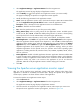
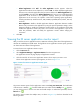
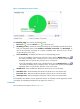
Figure 176 Connections area layout
The Connections area contains the following fields:
• Refresh icon —Click the Refresh icon to refresh the area.
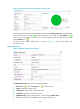
• Last 1 hour icon —The per-second connection number trend graph shows the trend of the
per-second connection numbers in the last hour by default. To change the report period, click the
Last 1 hour icon on the upper right of the graph, and select Last 6 hour , Today ,
Yesterday , This week , This month , or This year from the list.
• Connection number trend graph—Shows the connection number trend in a line graph. To view the
per-second connection number of a sampling point, place the cursor over the sampling point of the
curve.
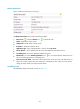
• Attribute/Value—Monitor index name and data.
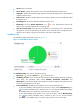
Connections—Number of connections between the clients and the IIS server when APM last
polled the IIS server.
History Record icon —Click the History Data icon to view the trend statistics of the
history connection number in a line graph. By default, the graph shows the last hour statistics.
To change the report period, click the Last 6 Hours icon , Today icon , Yesterday icon
, This Week icon , This Month icon , or This Year icon on the upper right of the
graph as needed. When Last 1 hour, Last 6 hour, or Today is selected, the connection
number of the IIS server is collected at the polling interval of the IIS server. When Today, This
week, or This month is selected, the connection number of the IIS server is collected in hours.
The statistics include the maximum value, minimum value, and average value for the index.
When This Year is selected, the connection number of the IIS server is collected in days. The
statistics include the maximum value, minimum value, and average value for the index. To
view the data of a specific sampling point, place the cursor over the sampling point.
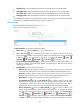
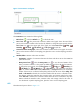
HTTP
The HTTP area layout is shown in Figure 177.