
HP Intelligent Management Center v5.1 SP1 Application Manager Administrator Guide


241
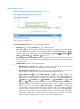
select this parameter, APM will modify the application monitor without verifying the
connection.
4. Click OK.
Viewing the PHP application monitor report
After you add the PHP application monitor, APM starts collecting index data of the application to
calculate its availability and health status. Through the PHP application monitor report, operators can
obtain monitor indexes of the application.
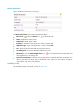
To access the PHP application monitor report:
1. Click the Resource tab.
2. Select Application Manager > Application Monitor from the navigation tree.
The application monitor list page displays all application monitors.
3. Click the name link of a PHP application monitor whose report you want to view.
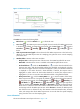
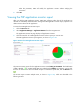
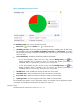
The PHP application monitor report appears, as shown in Figure 182.
Figure 182 Part of a PHP application monitor report
The previous monitor report is for the application monitor named PHP_10.154.240.55. The health status
of PHP is Healthy . If another health status icon rather than the Healthy icon appears, you can click
that icon to view the root cause and health analysis. To refresh the report data, click the Refresh icon
.
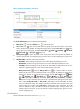
The monitor report contains multiple areas, as shown in Figure 183, which are described in the
following sections.