
HP Intelligent Management Center v5.1 SP1 Application Manager Administrator Guide

244
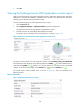
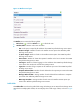
Figure 185 Response Time area layout
The Response Time area contains the following fields:
• Refresh icon —Click the Refresh icon to refresh the area.
• Last 1 hour icon —The response time trend graph shows the trend of the response time in the
last hour by default. To change the report period, click the Last 1 hour icon on the upper right
corner of the graph, and select Last 6 hour , Today , Yesterday , This week , This
month , or This year from the list.
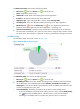
• PHP response time trend graph—Shows the trend of the PHP response time in the last hour by
default. To view the response time of a sampling point, place the cursor over the sampling point of
the curve.
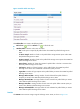
• Attribute/Value—Monitor index name and data.
Response Time—Response time of PHP when APM last polled PHP. Response time refers to the
length of time it takes for APM to send a request to PHP plus the length of time it takes for APM
to receive the PHP response.
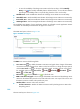
Set Threshold icon —Click the Set Threshold icon to set the alarm thresholds for the
response time index. With the thresholds enabled, the thresholds are displayed as broken
lines in the response time trend graph: the level-1 threshold is displayed in yellow, and the
level-2 threshold is displayed in red. When the level-1 alarm threshold is reached, the index
value is highlighted in yellow. When the level-2 alarm threshold is reached, the index value is
highlighted in red. You can use either user-defined thresholds or the global thresholds.
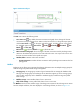
History Record icon —Click the History Record icon for to view statistics of the history
response time trend of PHP in a line graph. By default, the graph shows the last hour statistics.
To change the report period, click the Last 6 Hours icon , Today icon , Yesterday icon
, This Week icon , This Month icon , or This Year icon on the upper right of the
graph as needed. When Last 1 hour, Last 6 hour, or Today is selected, the PHP response time
is collected at the polling interval of PHP. When Yesterday, This week, or This month is
selected, the PHP response time is collected in hours. The statistics include the maximum value,
minimum value, and average value for the PHP response time. When This Year is selected, the
PHP response time is collected in days. The statistics include the maximum value, minimum
value, and average value for the PHP response time. To view the data of a specific sampling
point, place the cursor over the sampling point.