
HP Intelligent Management Center v5.1 SP1 Application Manager Administrator Guide

251
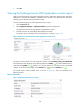
Figure 190 POP area layout
The POP area contains the following fields:
• Last 1 Hour icon —By default, the POP connection trend graph shows changes of the POP
connections used by Exchange Server 2003 over the last one hour. To change the report period,
click the Last 1 Hour icon on the upper right of the graph, and then select an icon from the
list. Available options include Last 6 Hours , Today , Yesterday , This Week , This
Month , and This Year .
• Refresh icon —Click the Refresh icon to refresh the area.
• POP connection trend graph—Shows changes of the POP connections used by Exchange Server
2003 over the selected time period in a line chart. Place the cursor over a spot in the curve to view
the POP connection number at the specific time point.
• Attribute/Value—Monitor index name and data.
Current Connections—Number of POP connections used by Exchange Server 2003 in the last
polling period.
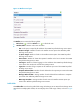
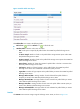
Mailbox
Exchange Server allows you to organize the Exchange information store into multiple storage groups for
mailbox storage and public folder storage management.
• Storage group—A storage group contains log and assistant files to manage the databases that
belong to the storage group. An Exchange Server 2003 host supports up to four storage groups,
each of which supports up to five databases. Databases apply to mailbox storage and public
folder storage.
• Mailbox storage—Stores mailbox data of one or more users.
• Public folder storage—Stores public folder data of one or more users.
The Mailbox area shows the mailbox usage of Exchange Server 2003. If the Exchange Server 2003
host has multiple mailboxes, this area displays the overall usage of them, as shown in Figure 191.