
HP Intelligent Management Center v5.1 SP1 Application Manager Administrator Guide

293
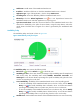
• Unavailable Time—Total unavailable time duration of the SOAP-based Web service since 00:00
today.
• Inaccessible Time—Total inaccessible time duration of the SOAP-based Web service since 00:00
today.
• Unmanaged Time—Total unmanaged time duration of the SOAP-based Web service since 00:00
today.
The availability time statistics of a new application monitor are collected since the application monitor
was added. An availability time field does not appear if its value is 0.
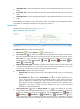
Response Time
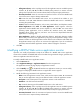
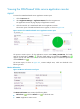
The Response Time area layout is shown in Figure 229.
Figure 229 Response time area layout
The Response Time area contains the following fields:
• Refresh icon —Click the Refresh icon to refresh the area.
• Last 1 Hour icon —By default, the response time trend graph shows changes of the response
time of the SOAP-based Web service over the last one hour. To change the report period, click the
Last 1 Hour icon on the upper right of the graph, and then select an icon from the list.
Available options include Last 6 Hours , Today , Yesterday , This Week , This
Month , and This Year .
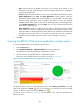
• Response time trend graph—By default, the graph shows changes of the round trip response time
of the SOAP-based Web service over the last one hour in a line chart. Place the cursor over a spot
in the curve to view the service response time at the specific time point.
• Attribute/Value—Monitor index name and data.
Response Time—Round trip response time of the SOAP-based Web service in the last polling
period.
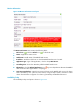
Set Threshold icon —Click the Set Threshold icon to set alarm thresholds for the
service response time. The specified alarm thresholds appear on the response time trend
graph as dotted lines in different colors: yellow for the level-1 threshold and red for level-2.
The response time value is highlighted in yellow when it reaches the level-1 threshold, and is
highlighted in red when it reaches the level-2 threshold. You can use either the global
thresholds or user-defined thresholds.
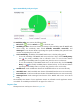
• History Record icon —Click the History Record icon to view statistics of the history
response time trend of the SOAP-based Web service in a line graph. By default, the graph shows
the last hour statistics. To change the report period, click the Last 6 Hours icon , Today icon
, Yesterday icon , This Week icon , This Month icon , or This Year icon on the
upper right of the graph as needed. Hourly data and today's data is collected every polling
interval, yesterday's, weekly, and monthly data is collected in hours, and yearly data is collected