HP Intelligent Management Center v5.1 SP1 Application Manager Administrator Guide
Manuals
Brands
HP Manuals
Computer Accessories
HP IMC Application Manager additional 100-monitor License
301
302
303
304
305
306
307
308
309
310
294
i
n
d
ays
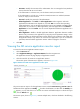
. The statistics gr
aph contains maximum, mini
mu
m
, and a
ver
age
resp
on
se ti
mes
.
Pl
a
c
e
the
cur
sor
ov
er a sp
ot in the c
urve t
o v
ie
w
r
e
spon
s
e tim
es
of t
he s
erv
i
ce
at the
spe
c
ific time po
int.
1
...
...
299
300
301
302
303
...
...
355