
HP Intelligent Management Center v5.1 SP1 Application Manager Administrator Guide


297
Username—Modify the username of the administrator who can manage the host (Windows
Server) where the AD service is located.
If the administrator is a domain user, use the domain name\username format.
If the administrator is a local user, use the host name\username or IP address\username
format, or simply use the username.
Password—Modify the password of the administrator.
Related Applications—Click Add. The Select Applications window appears. Select the
applications that the AD service depends on, and click OK. You cannot select operating
system applications, such as Windows XP, Windows Server, AIX, FreeBSD, OpenBSD, HP-UX,
Solaris, Mac OS, and Linux. To delete applications, select the applications in the Related
Applications box and click Delete. You can view the dependencies between applications in a
topology view.
Detect Application—Enable or disable application detection. Application detection enables
APM to verify connection to the application by using the previous parameter settings, and to
determine whether to add the application monitor based on the verification result. APM adds
the application monitor only when it can connect to the application. If you do not select this
parameter, APM will add the application monitor without verifying the connection.
5. Click OK.
Viewing the AD service application monitor report
To access the AD service application monitor report:
1. Click the Resource tab.
2. Select Application Manager > Application Monitor from the navigation tree.
The application monitor list page displays all application monitors.
3. Click the name link of an AD service application monitor.
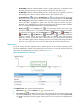
The monitor report of the AD service appears, as shown in Figure 230.
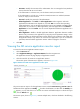
Figure 230 Part of an AD service application monitor report
The previous monitor report is for the application monitor named Active Directory_192.168.1.44. The
health status of the application is Healthy . If another health status icon rather than the Healthy icon
appears, you can click that icon to view the root cause and health analysis. To refresh the report
data, click the Refresh icon .
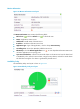
The monitor report, shown in Figure 231, contains multiple areas, which are described in the following
sections.