
HP Intelligent Management Center v5.1 SP1 Application Manager Administrator Guide


300
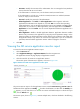
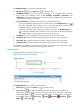
• ABClient sessions trend graph—Shows changes of the ABClient session number for the AD service
over the last one hour in a line chart. Place the cursor over a spot in the curve to view the session
number at the specific time point.
• Attribute/Value—Monitor index name and data.
ABClient Sessions—Number of connected ABClient sessions of the AD service in the last APM
polling period.
DS Notification Queue Size—Number of pending update notifications that have been queued
but not yet sent to clients in the last APM polling period.
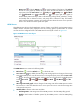
History icon —Click the History icon to view the statistics of the history of the network
monitor index data in a line graph. By default, the graph shows the last hour statistics. To
change the report period, click the Last 6 Hours icon , Today icon , Yesterday icon
, This Week icon , This Month icon , or This Year icon on the upper right of the
graph as needed. Hourly data and today's data is collected every polling interval,
yesterday's, weekly, and monthly data is collected in hours, and yearly data is collected in
days. The statistics graph contains maximum, minimum, and average network monitor index
data. Place the cursor over a spot in the curve to view the network monitor index data at the
specific time point.
Database
The database of the AD service is the ntds.dit file, which is the core of the AD service and stores large
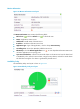
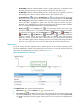
amount of domain data. The Database area layout is shown in Figure 234.
Figure 234 Database area layout
The Database area contains the following fields:
• Refresh icon —Click the Refresh icon to refresh the area.
• Last 1 Hour icon —By default, the ntds.dit file size trend graph shows changes of the file size
over the last one hour. To change the report period, click the Last 1 Hour icon on the upper
right of the graph, and then select an icon from the list. Available options include Last 6 Hours
, Today , Yesterday , This Week , This Month , and This Year .
• Database file size trend graph—Shows changes of the ntds.dit file size over the last one hour in a
line chart. Place the cursor over a spot in the curve to view the file size at the specific time point.
• Attribute/Value—Monitor index name and data.
File Size—Size of the ntds.dit file in the last APM polling period.