
HP Intelligent Management Center v5.1 SP1 Application Manager Administrator Guide


303
include Last 6 Hours , Today , Yesterday , This Week , This Month , and This
Year .
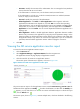
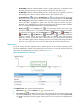
• CPU usage ratio trend graph—Shows changes of CPU usage ratio of the LSASS process over the
last one hour in a line chart. Place the cursor over a spot in the curve to view the CPU usage ratio
at the specific time point.
• Attribute/Value—Monitor index name and data.
CPU Usage Ratio—CPU usage ratio of the LSASS process in the last APM polling period.
Handles—Total number of handles opened by the LSASS process in the last APM polling
period.
IO Read Rate—Rate at which the LSASS process is reading data from I/O operations in the
last APM polling period. The I/O activity includes network, file, and device I/Os.
IO Write Rate—Rate at which the LSASS process is writing data to I/O operations in the last
APM polling period. The I/O activity includes network, file, and device I/Os.
Set Threshold icon —Click the Set Threshold icon to set alarm thresholds for the CPU
usage ratio of the LSASS process. The specified alarm thresholds appear on the CPU usage
ratio trend graph as dotted lines in different colors: yellow for the level-1 threshold and red for
level-2. The data is highlighted in yellow when the CPU usage ratio reaches the level-1
threshold, and is highlighted in red when the CPU usage ratio reaches the level-2 threshold.
You can use either the global thresholds or user-defined thresholds.
History icon —Click the History icon to view the history statistics of the CPU usage
ratio of the LSASS process in a line graph. By default, the graph shows the last hour statistics.
To change the report period, click the Last 6 Hours icon , Today icon , Yesterday icon
, This Week icon , This Month icon , or This Year icon on the upper right of the
graph as needed. Hourly data and today's data is collected every polling interval,
yesterday's, weekly, and monthly data is collected in hours, and yearly data is collected in
days. The statistics graph contains maximum, minimum, and average CPU usage ratio. Place
the cursor over a spot in the curve to view the CPU usage ratio at the specific time point.
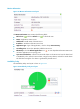
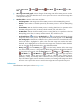
Performance
The Performance area layout is shown in Figure 237.