
HP Intelligent Management Center v5.1 SP1 Application Manager Administrator Guide


304
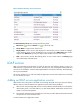
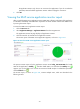
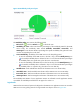
Figure 237 Performance area layout
The Performance area contains the following fields:
• Refresh icon —Click the Refresh icon to refresh the area.
• Last 1 Hour icon —By default, the performance trend graph shows changes of directory
reads/writes per second over the last one hour. To change the report period, click the Last 1 Hour
icon on the upper right of the graph, and then select an icon from the list. Available options
include Last 6 Hours , Today , Yesterday , This Week , This Month , and This
Year .
• Performance trend graph—Shows changes of directory reads/writes per second over the last one
hour in a line chart. Place the cursor over a spot in the curve to view the detailed data at the
specific time point.
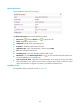
• Attribute/Value—Monitor index name and data.
Client Bindings/Sec—Number of DC-to-client bindings per second in the last APM polling
period.
Server Bindings/Sec—Number of DC-to-DC bindings per second in the last APM polling
period.
Directory Reads/Sec—Number of reads from directory per second in the last APM polling
period.
Directory Writes/Sec—Number of writes to directory per second in the last APM polling
period.
Kerberos Authentications—Number of times per second that clients use a ticket to this DC to
authenticate to this DC in the last APM polling period.
NTLM Authentications—Number of NTLM authentications serviced by this DC per second in
the last APM polling period.
History icon —Click the History icon to view the statistics of the history of the AD
performance index data in a line graph. By default, the graph shows the last hour statistics. To