
HP Intelligent Management Center v5.1 SP1 Application Manager Administrator Guide


305
change the report period, click the Last 6 Hours icon , Today icon , Yesterday icon
, This Week icon , This Month icon , or This Year icon on the upper right of the
graph as needed. Hourly data and today's data is collected every polling interval,
yesterday's, weekly, and monthly data is collected in hours, and yearly data is collected in
days. The statistics graph contains maximum, minimum, and average performance index data.
Place the cursor over a spot in the curve to view the performance index data at the specific
time point.
Copy Statistics
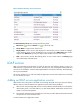
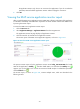
The Copy Statistics area layout is shown in Figure 238.
Figure 238 Copy Statistics area layout
The Copy Statistics area contains the following fields:
• Refresh icon —Click the Refresh icon to refresh the area.
• Last 1 Hour icon —By default, the inbound/outbound object trend graph shows changes of the
number of inbound/outbound objects per second over the last one hour. To change the report
period, click the Last 1 Hour icon on the upper right of the graph, and then select an icon
from the list. Available options include Last 6 Hours , Today , Yesterday , This Week
, This Month , and This Year .
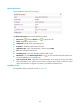
• Inbound/Outbound object trend graph—Shows changes of the number of inbound/outbound
objects per second over the last one hour in a line chart. Place the cursor over a spot in the curve
to view the number of inbound/outbound objects per second at the specific time point.
• Attribute/Value—Monitor index name and data.
Copied Objects/Sec—Rate at which replication updates received from ADs are applied by the
local AD in the last APM polling period. This counter excludes changes that are received but
not applied.
Left Objects/Sec—Number of object updates received in the current directory replication
update packet that have not yet been applied to the local AD in the last APM polling period.