
HP Intelligent Management Center v5.1 SP1 Application Manager Administrator Guide


314
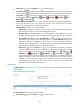
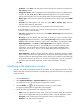
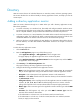
Figure 244 Login Details area layout
The Login Details area contains the following fields:
• Refresh icon —Click the Refresh icon to refresh the area.
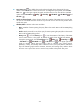
• Last 1 Hour icon —By default, the login time trend graph shows changes of the login time of
the LDAP service over the last one hour. To change the report period, click the Last 1 Hour icon
on the upper right of the graph, and then select an icon from the list. Available options include
Last 6 Hours , Today , Yesterday , This Week , This Month , and This Year .
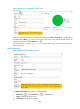
• Login time trend graph—Shows changes of the login time of the LDAP service over the last one
hour in a line chart. Place the cursor over a spot in the curve to view the login time at the specific
time point.
• Attribute/Value—Monitor index name and data.
Login Time—Time taken for APM to pass the LDAP authentication by using the LDAP username
and password in the last APM polling period.
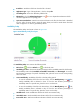
History icon —Click the History icon to view the statistics of the history of the LDAP
service login time in a line graph. By default, the graph shows the last hour statistics. To
change the report period, click the Last 6 Hours icon , Today icon , Yesterday icon
, This Week icon , This Month icon , or This Year icon on the upper right of the
graph as needed. Hourly data and today's data is collected every polling interval,
yesterday's, weekly, and monthly data is collected in hours, and yearly data is collected in
days. The statistics graph contains maximum, minimum, and average login times. Place the
cursor over a spot in the curve to view the login time at the specific time point.
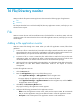
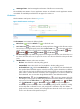
Search Details
After passing the LDAP authentication, APM queries all entries of the Search Base according to the
Search Base and query filter configured in the LDAP service application monitor. The Search Details
area layout is shown in Figure 245.
Figure 245 Search Details area layout
The Search Details area contains the following fields: