
HP Intelligent Management Center v5.1 SP1 Application Manager Administrator Guide


321
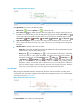
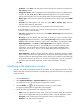
• IP Address—IP address of the host where the file is located.
• Application Type—Type of the application, which is always File.
• Last Polling Time—Time when APM last polled the file.
• Relationship—Click the Related Applications icon to view dependencies between the file
and other applications in a topology view.
• Top5 Unrecovered Alarm—Latest five unrecovered alarms on the file. The alarm level is identified
by color: yellow for minor alarms, orange for major alarms, and red for critical alarms. This field
does not appear if no alarm is generated by the file.
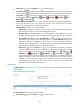
Availability Today
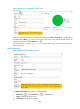
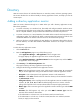
The Availability Today area layout is shown in Figure 249.
Figure 249 Availability Today area layout
The Availability Today area contains the following fields:
• Refresh icon —Click the Refresh icon to refresh the area.
• Availability pie chart—Shows time duration percentages of the availability states for the file today.
The availability states include Available, Unavailable, Inaccessible, and Unmanaged. To view the
time duration percentage of a specific availability state, place the cursor over the corresponding
slice in the chart.
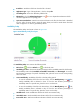
• Current Availability—Availability of the file in the last polling period.
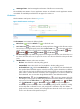
To view the availability of the file in the last 7 days, click the Weekly History icon . The
weekly availability data is collected in hours. To view the time duration percentages of
availability states at a specific time, place the cursor over that time.
To view the availability of the file in the last 30 days, click the Monthly History icon . The
monthly availability data is collected in days. To view the time duration percentages of
availability states on a specific day, place the cursor over that day.
• Available Time—Total available time duration of the file since 00:00 today.
• Unavailable Time—Total unavailable time duration of the file since 00:00 today.
• Inaccessible Time—Total inaccessible time duration of the file since 00:00 today.